See a report on the plan
A report lists its points. On the plan you see where they are: the report’s points stand out on each drawing, the Pages panel counts them page by page, and you can step from one to the next.
Put a report on the plan
Section titled “Put a report on the plan”-
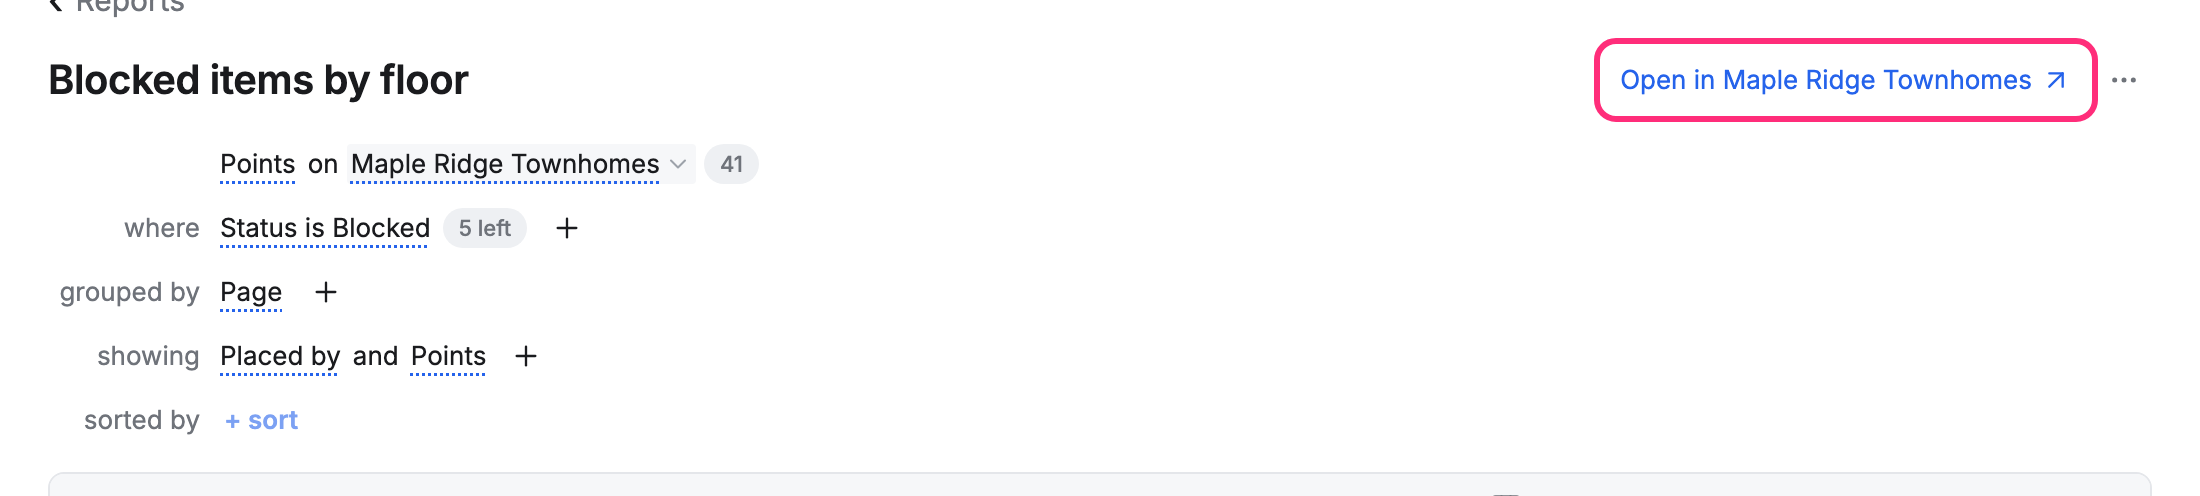
The whole report: at the top of a report, click Open in and the project’s name.
-
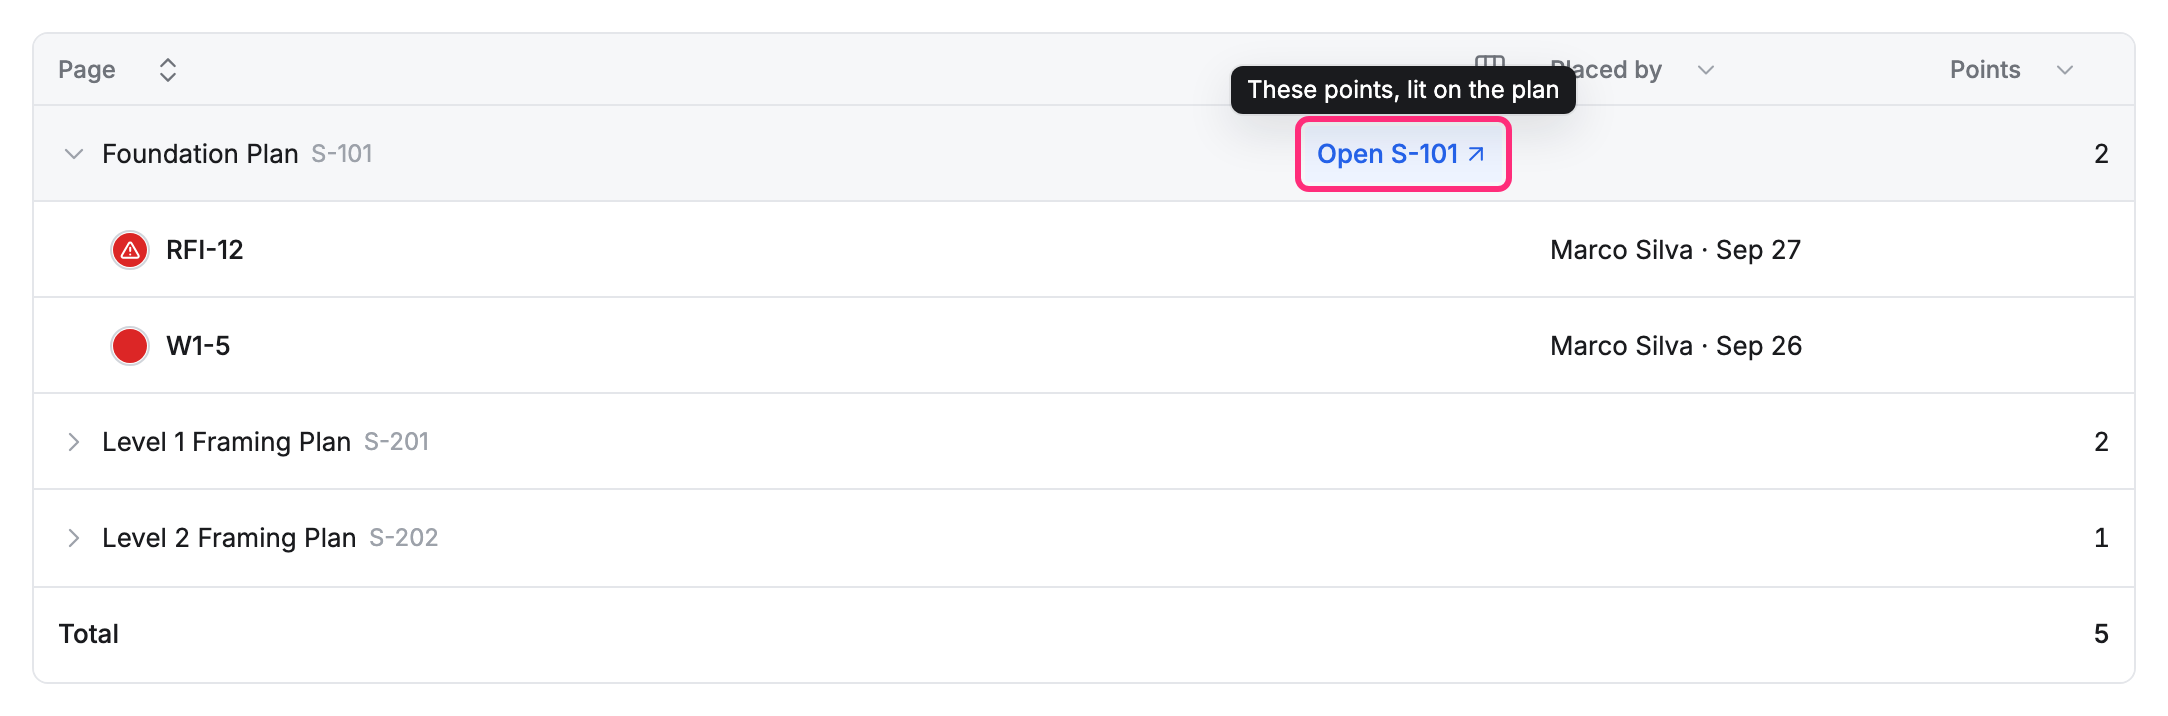
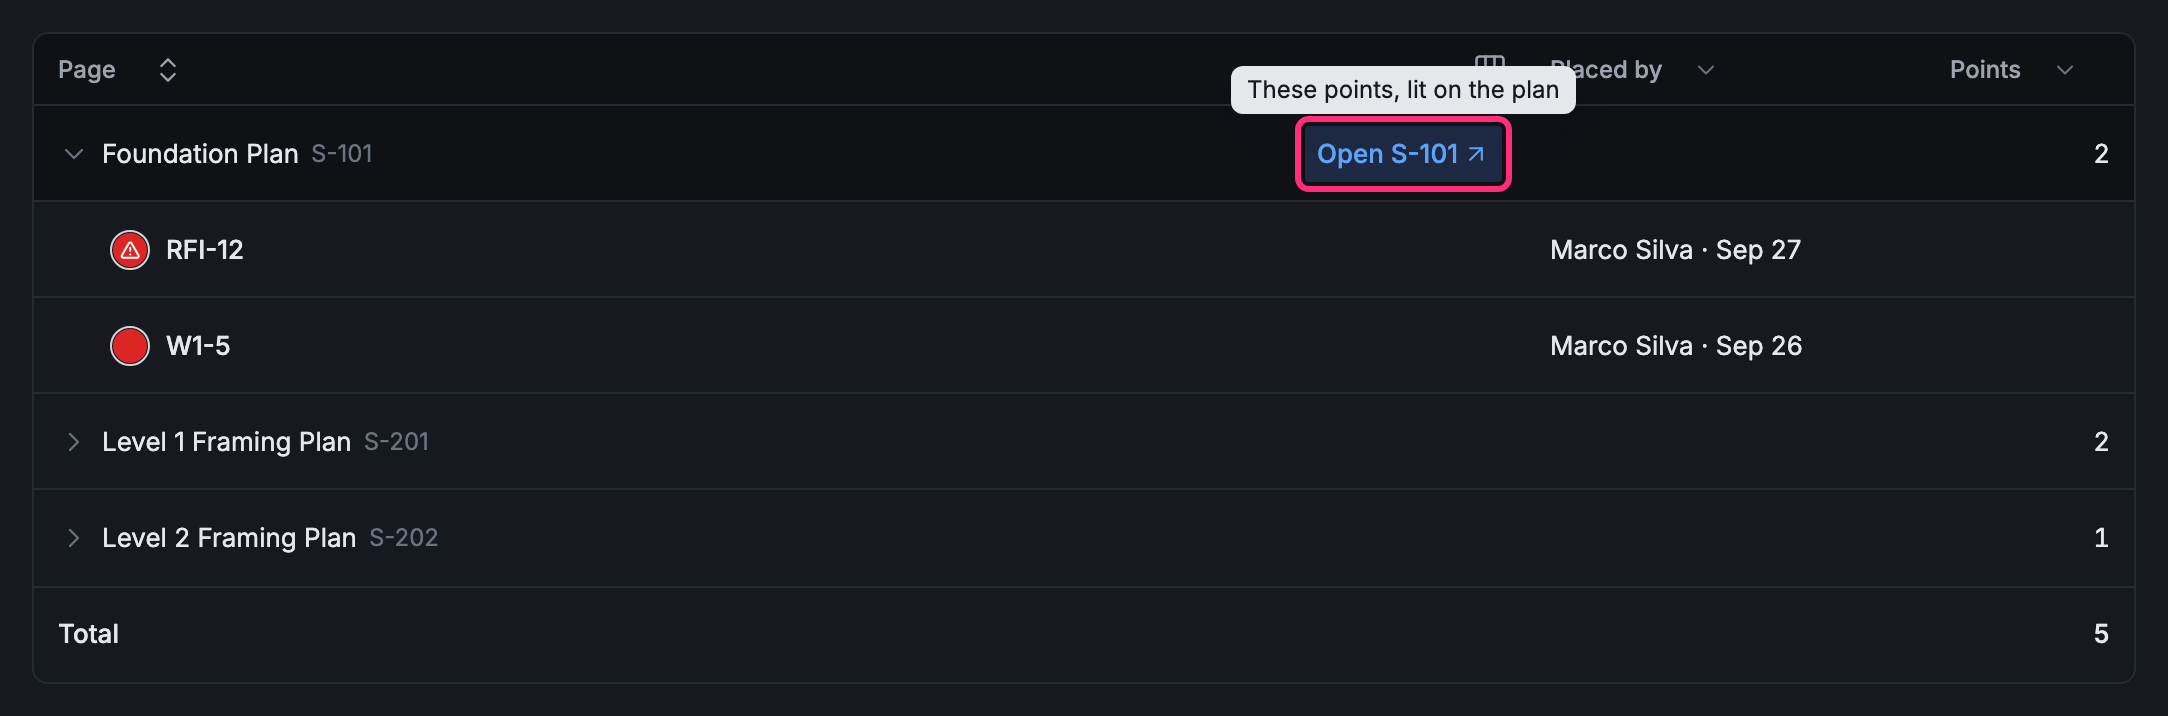
One row’s points: open a row, then click Open and its page (Open S-101 here). Only that row’s points stand out.
-
One point: see Run a report: click its row, then Open on plan on its card.
What you see on the plan
Section titled “What you see on the plan”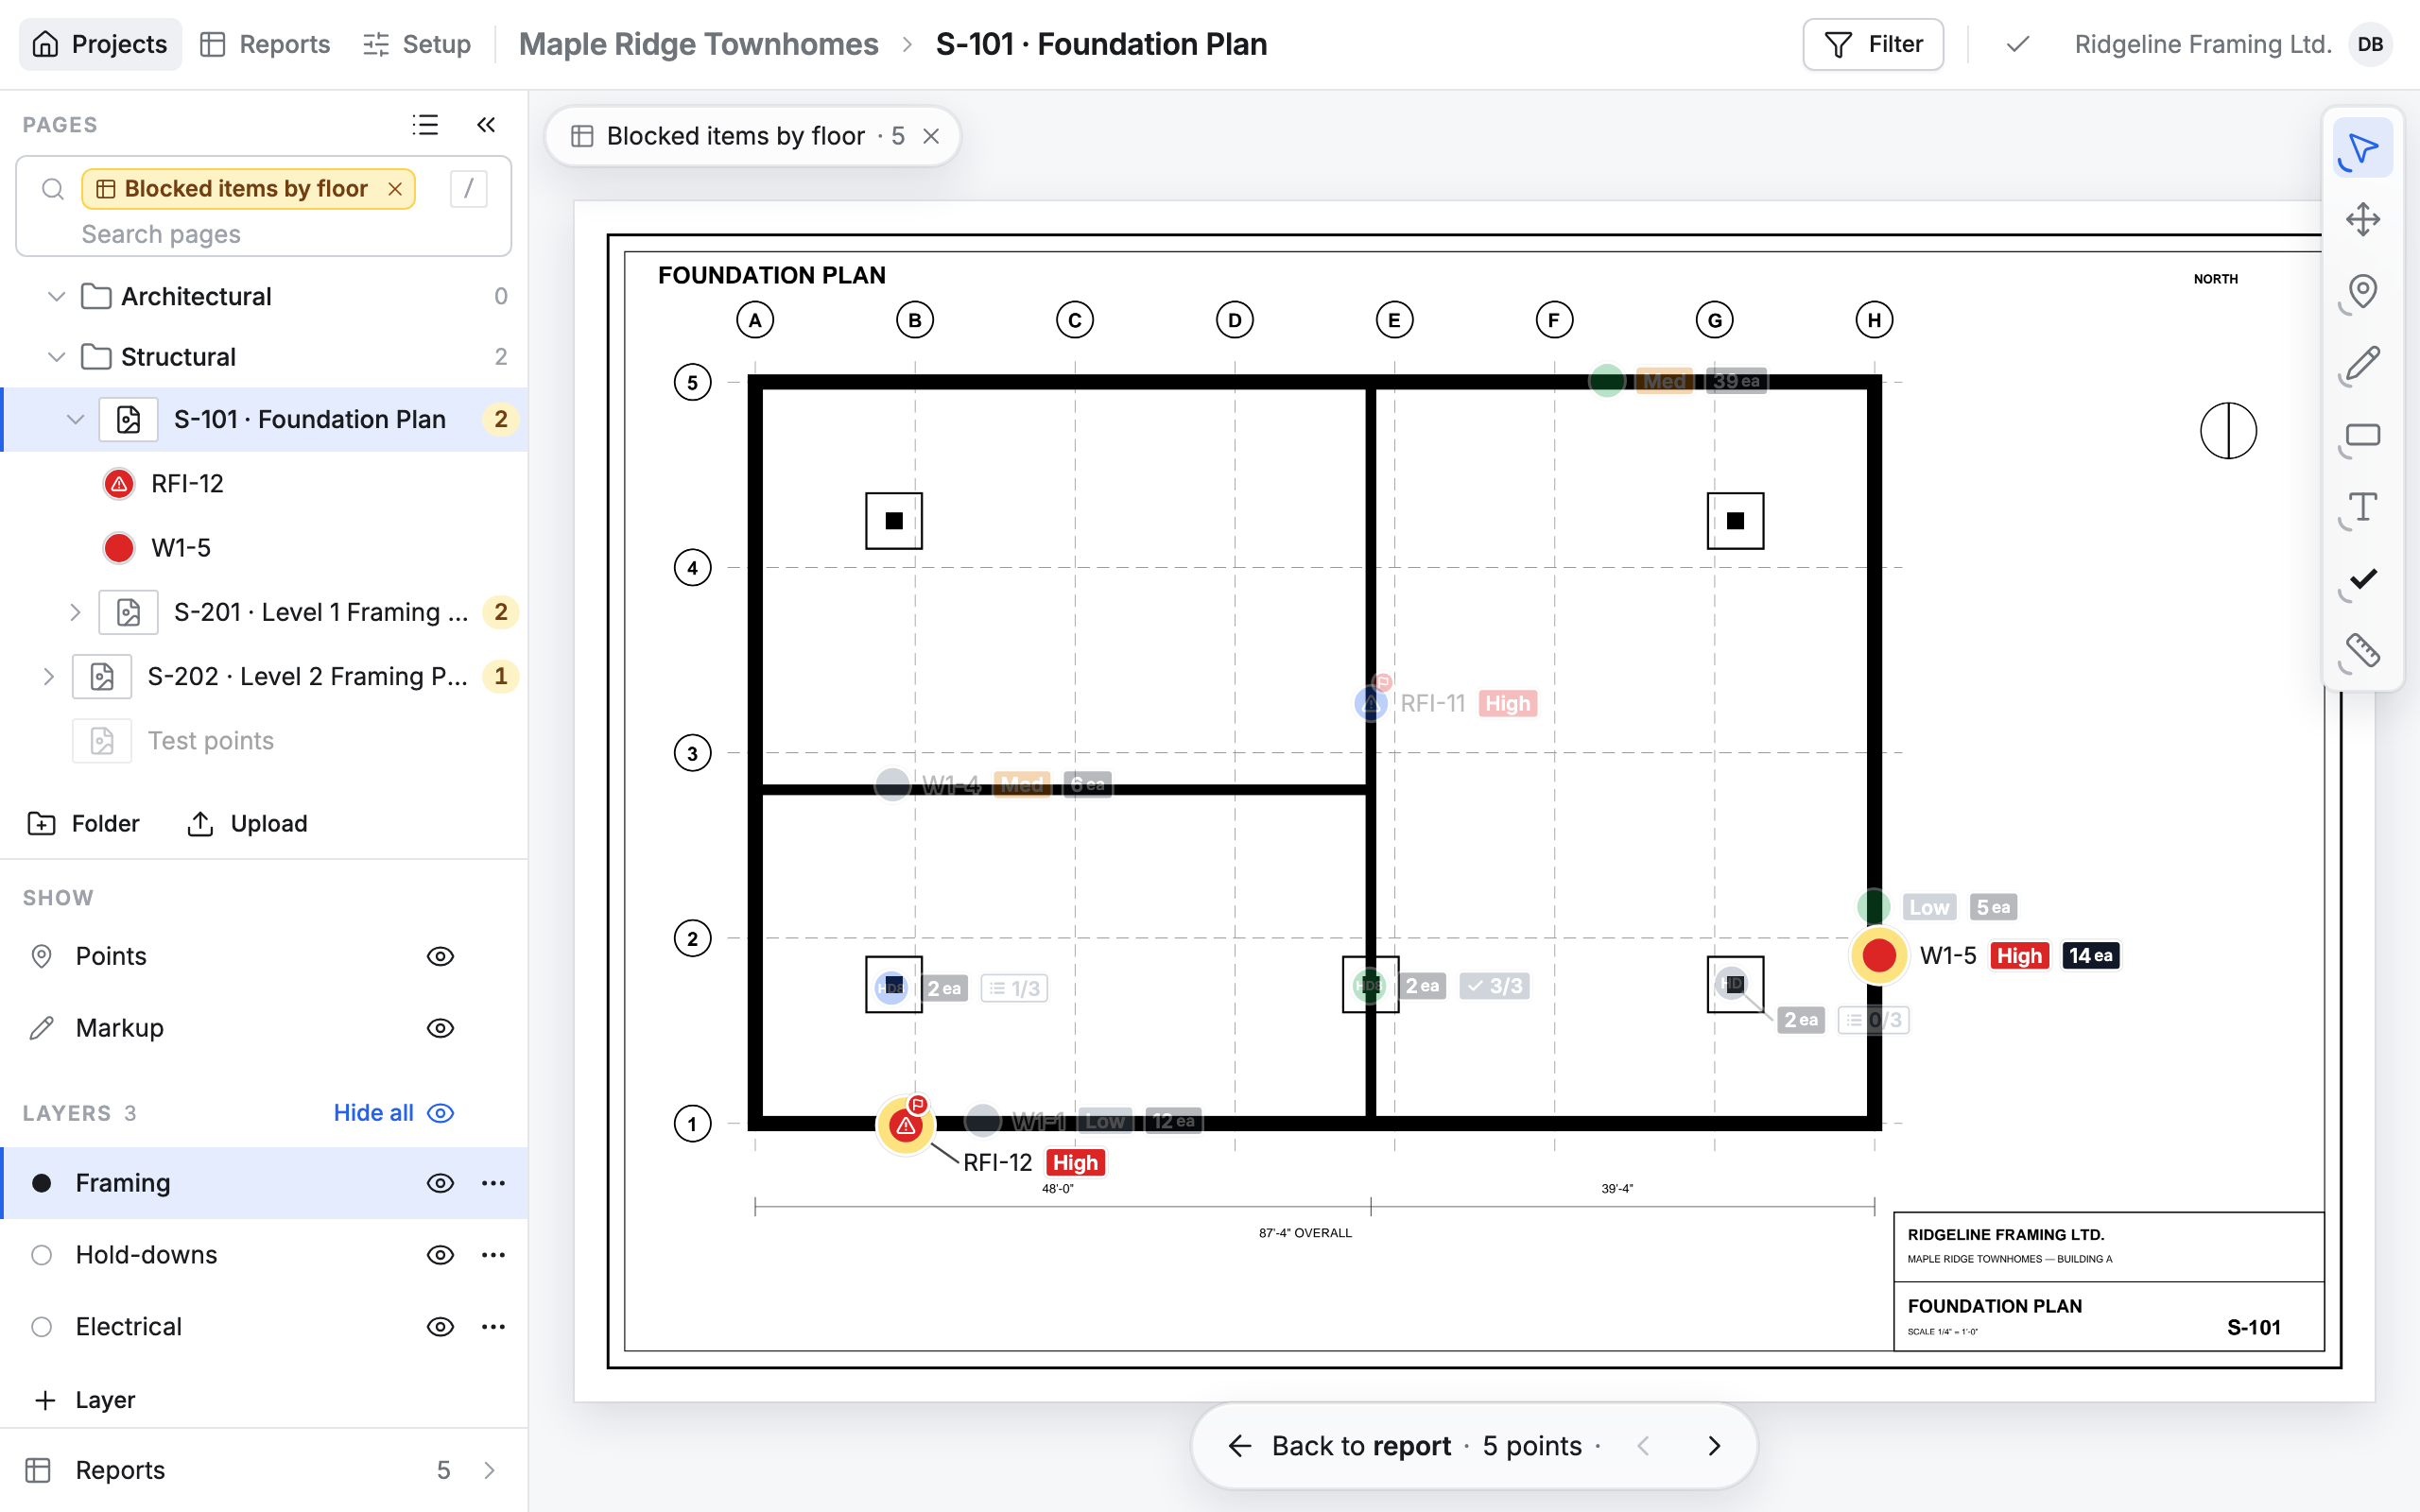
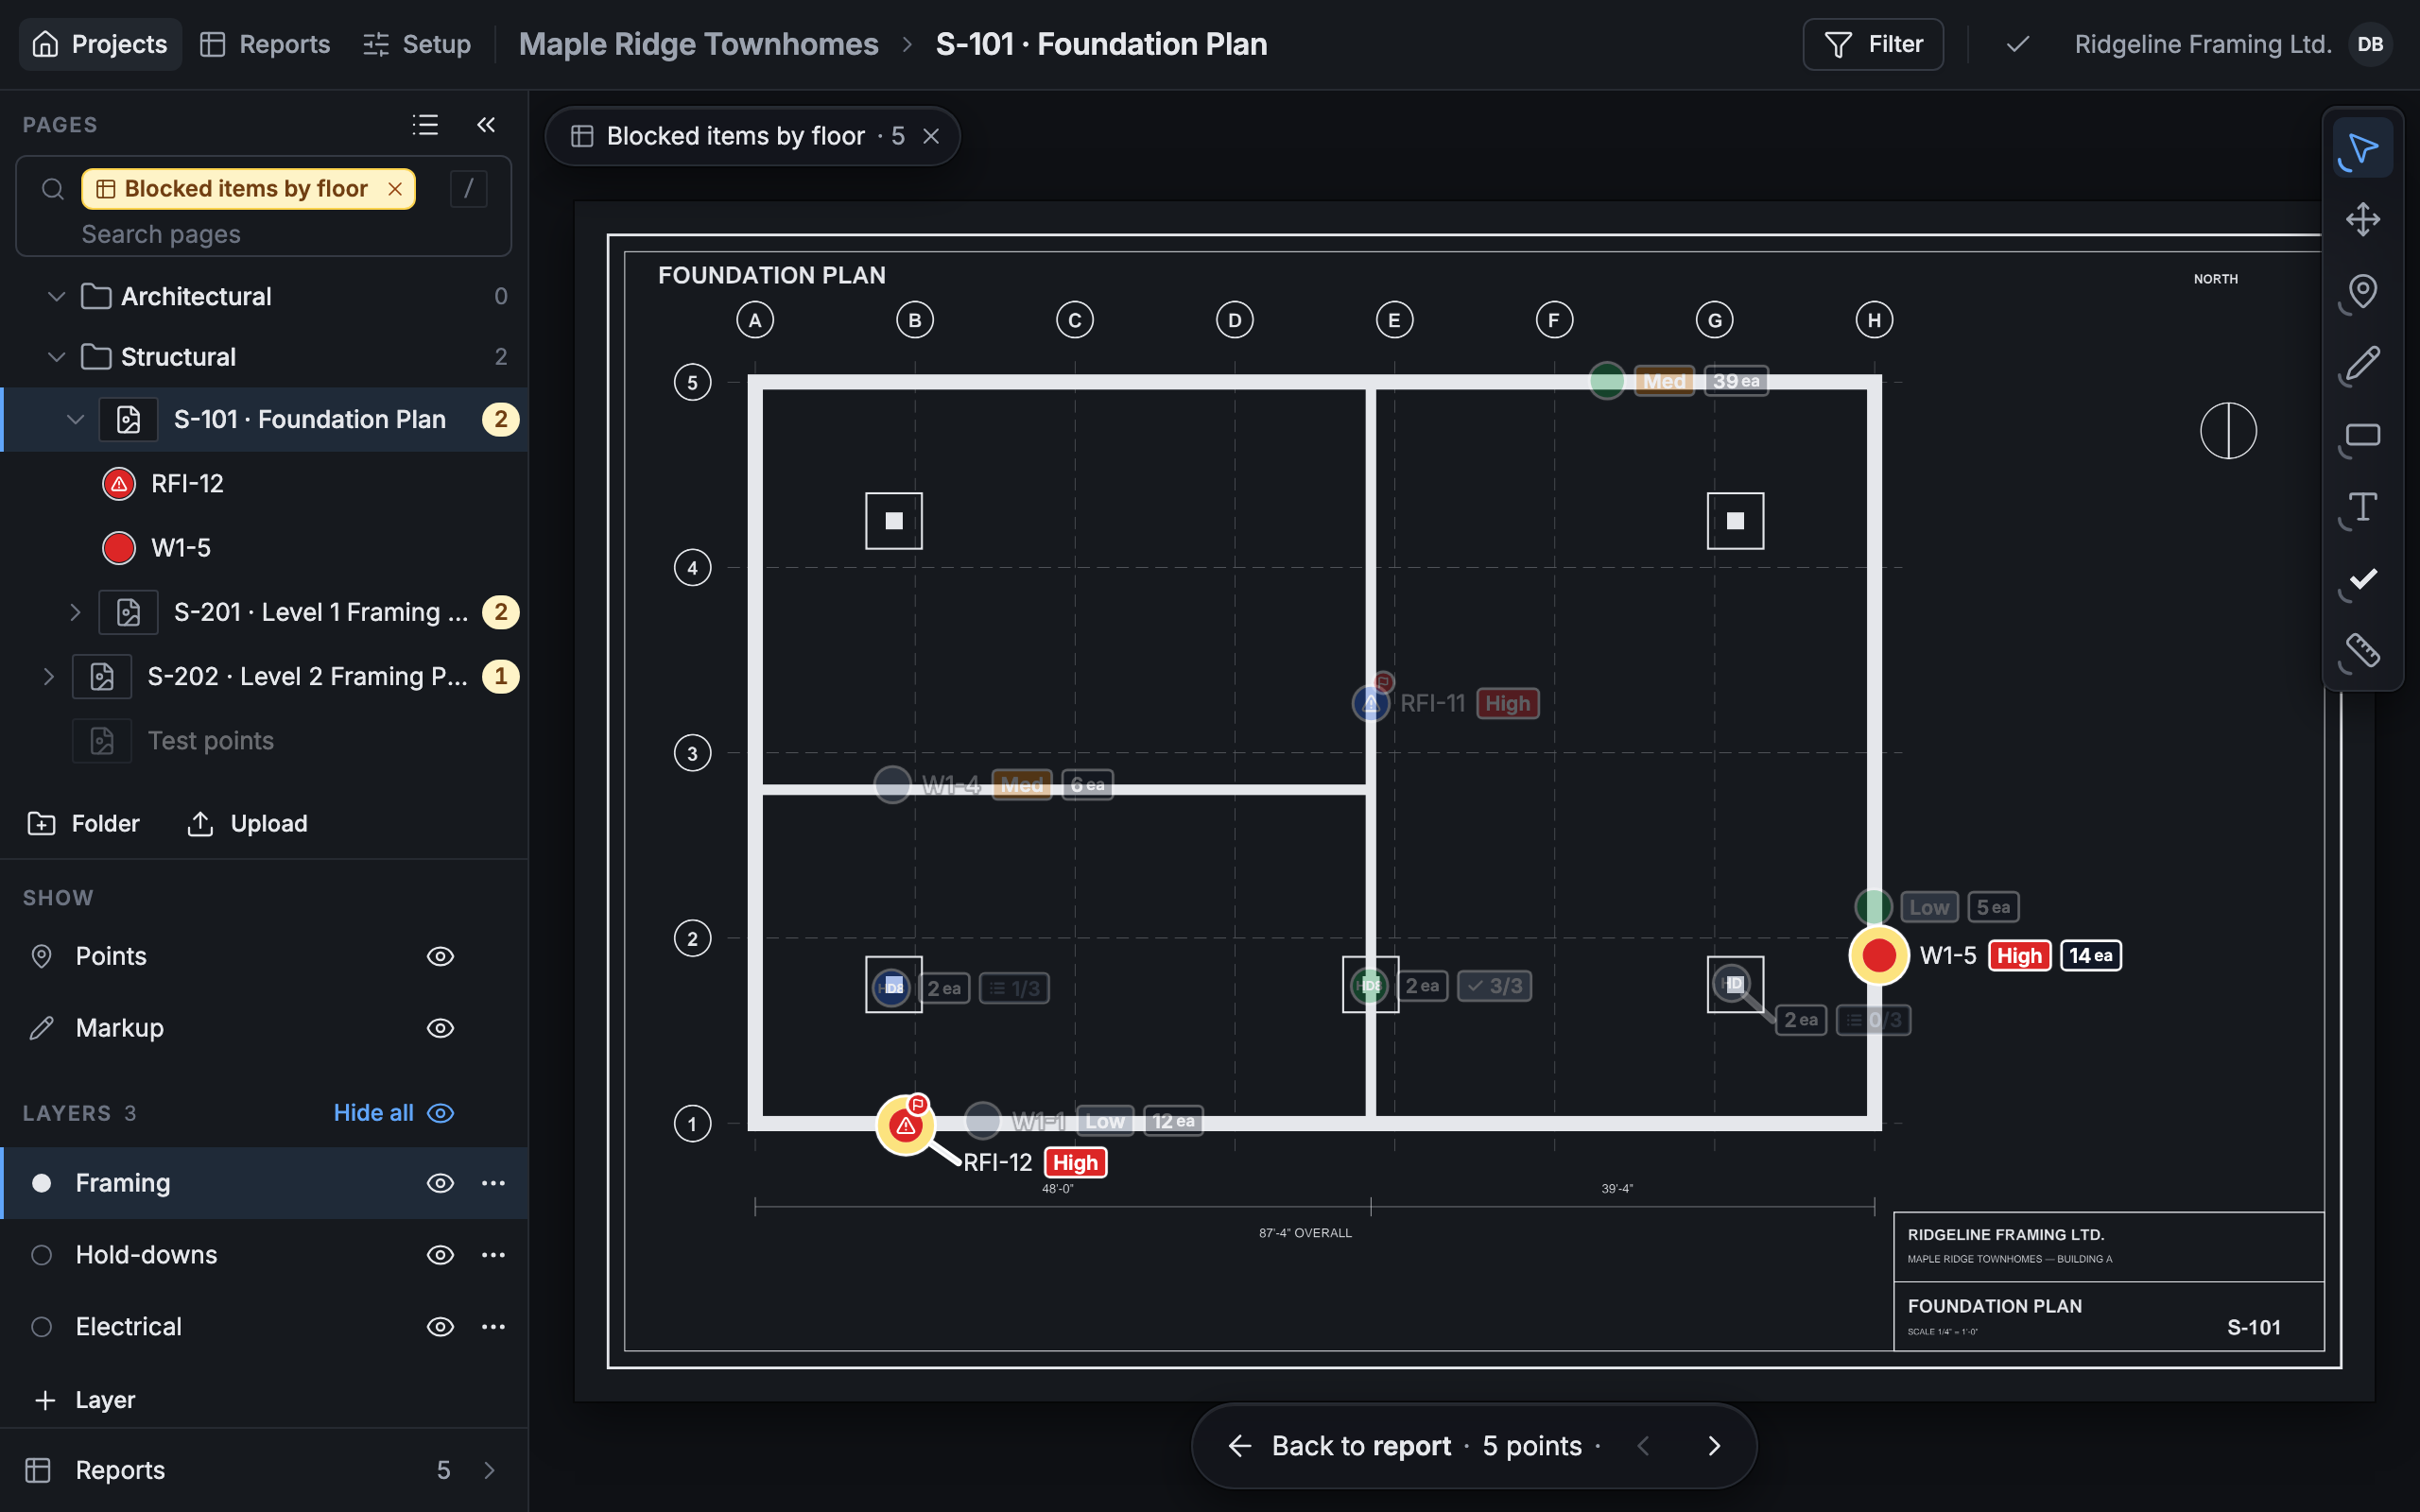
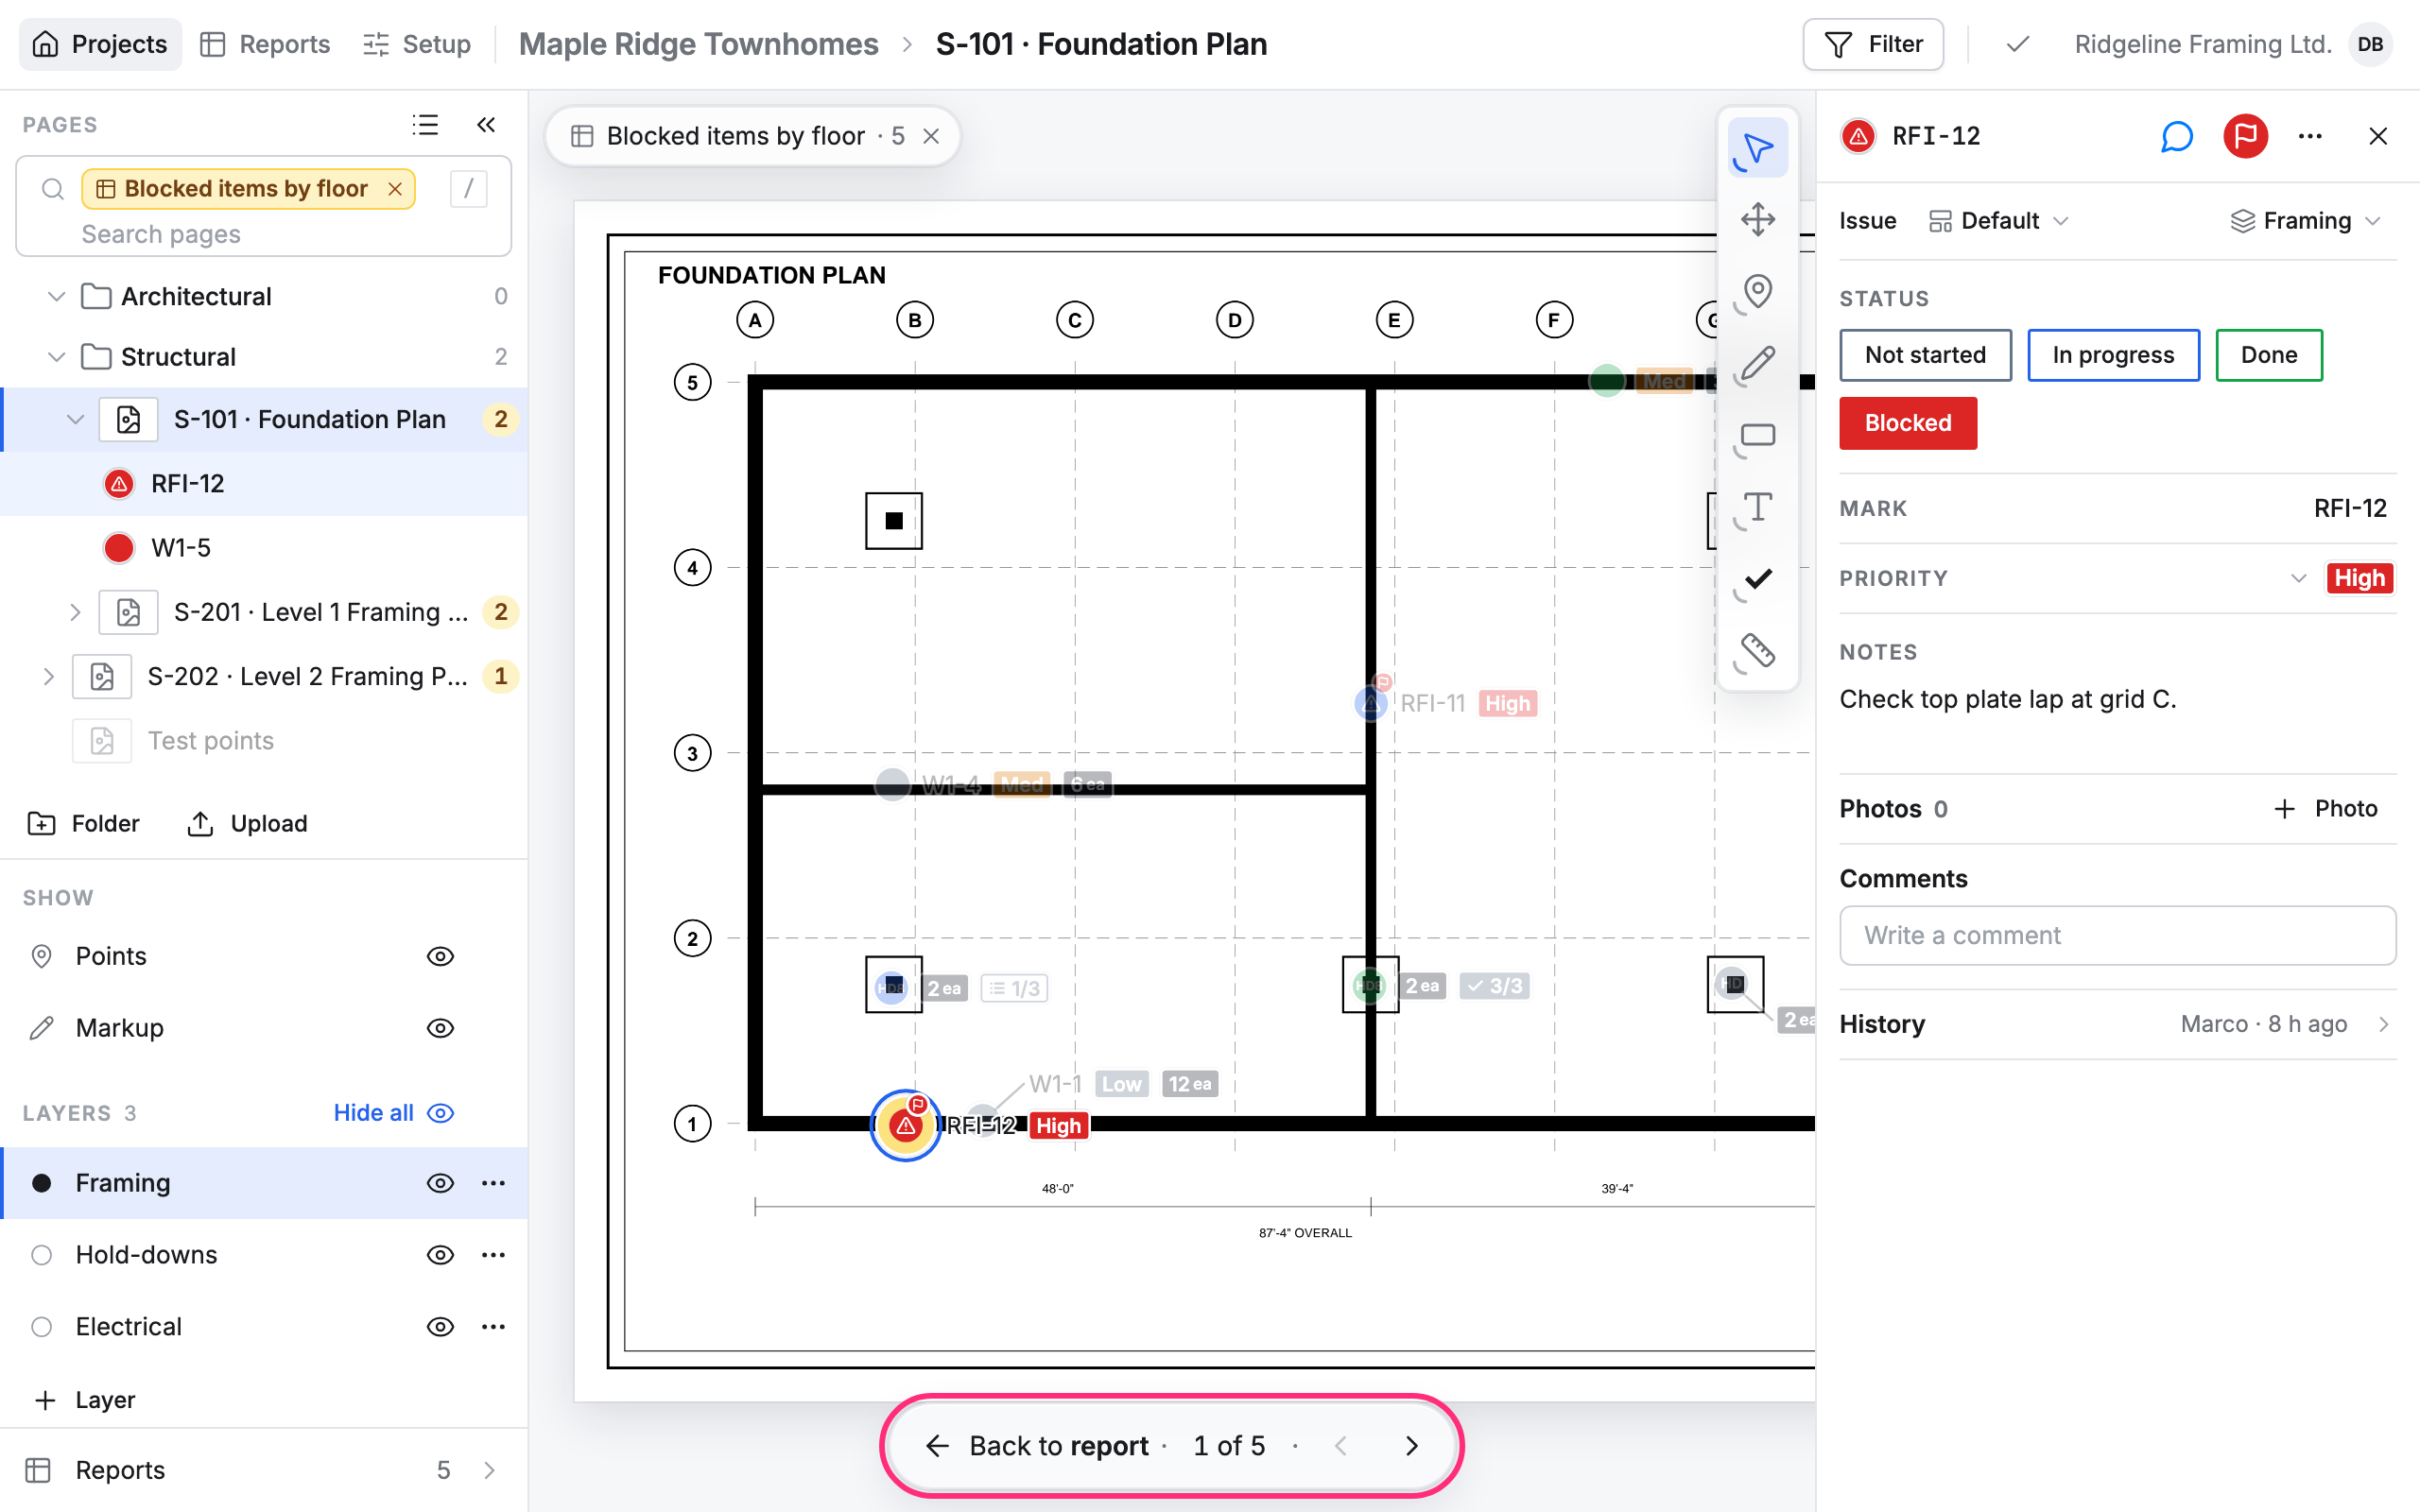
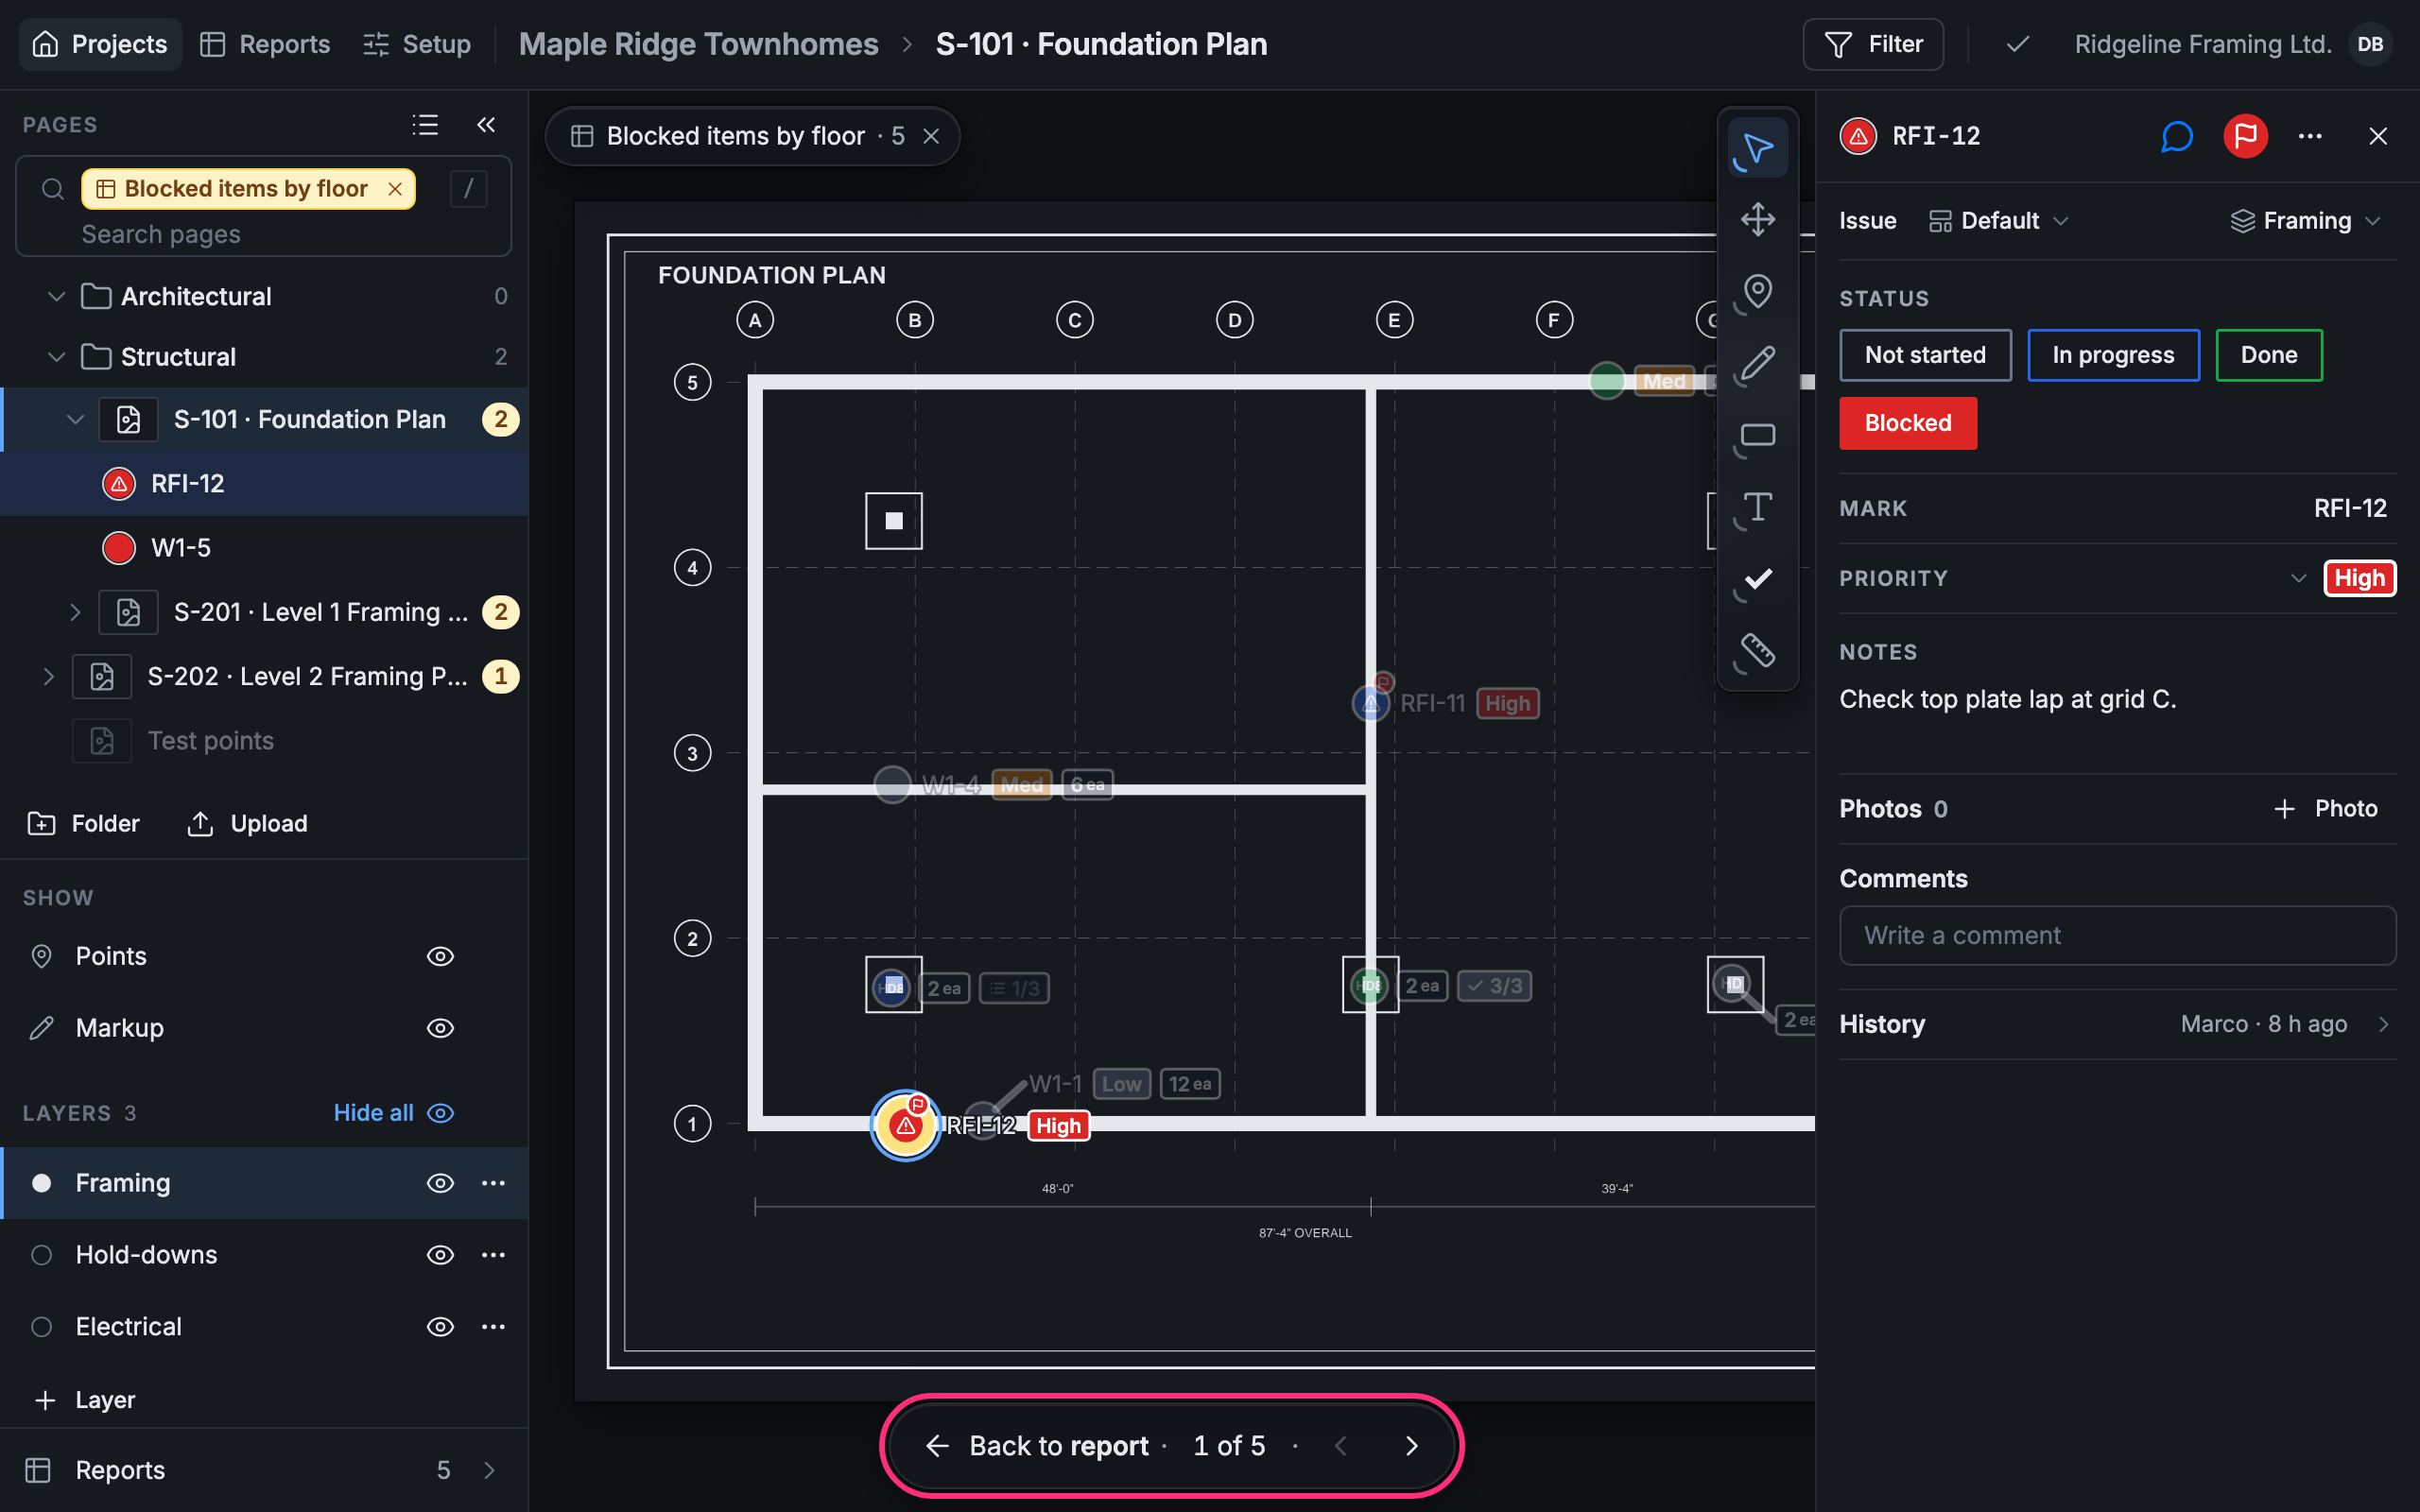
- The report’s points stand out on the drawing. The other points fade.
- Above the drawing, a chip names the report and counts its points in the project: Blocked items by floor · 5.
- The Pages panel stays as it was, with the report’s name in its search box. Each page that holds some of the report’s points shows how many; the other pages are dimmed.
- The page you’re on opens to list the report’s points under it. Click the arrow beside another page to list its points too. Point to a point in the list to ring it on the drawing.
- At the bottom, Back to report takes you back to the report, with its rows open as you left them.
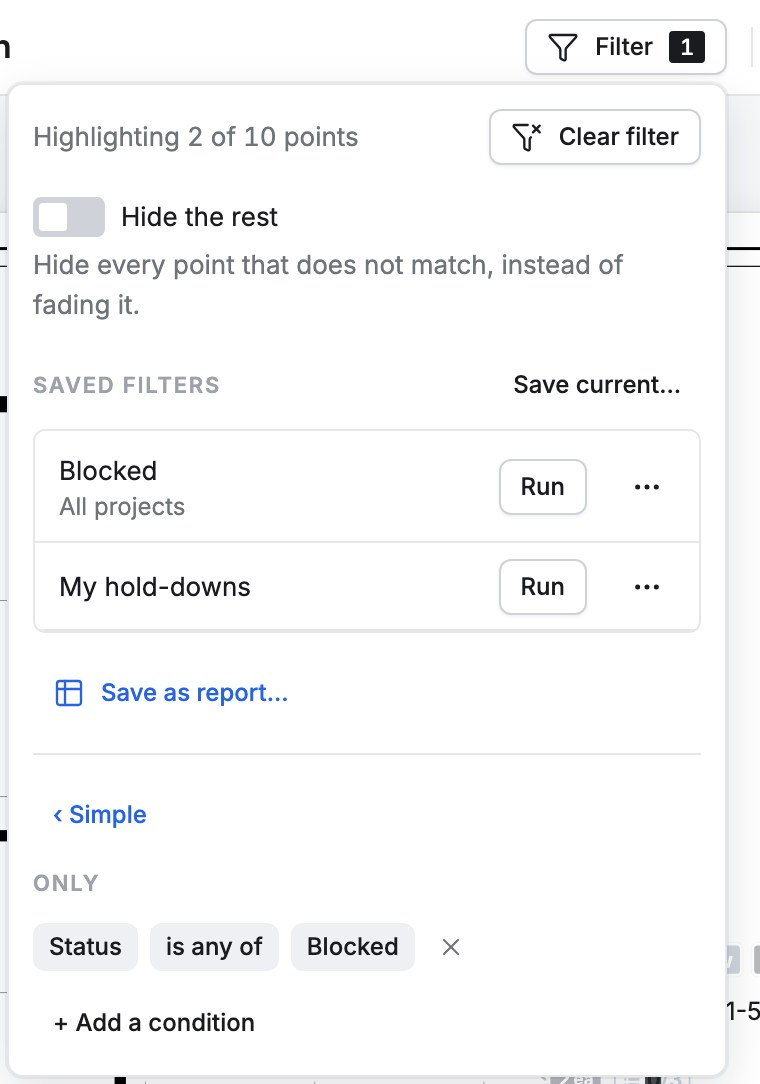
The filter’s count says the same for the page in view: click Filter at the top to see, for example, Highlighting 2 of 10 points.
Step through the points
Section titled “Step through the points”The bar at the bottom counts the report’s points (5 points). Its arrows go from one to the next:
- Click › to open the first point. The bar reads 1 of 5, and the point’s card opens on the right.
- Click › for the next one and ‹ for the one before. When the next point is on another page, the plan turns to it.
The keyboard does the same: ↓ or J for the next point, ↑ or K for the one before. The points go in the Pages panel’s order, page by page. Click a point in the panel to jump to it.
Stop showing the report
Section titled “Stop showing the report”Click the × on the report’s name in the search box, or on the chip above the drawing. Every point shows again. Back to report stays, so you can still go back.
Run the report again
Section titled “Run the report again”Click Filter at the top. The report’s name is at the top of the filter.
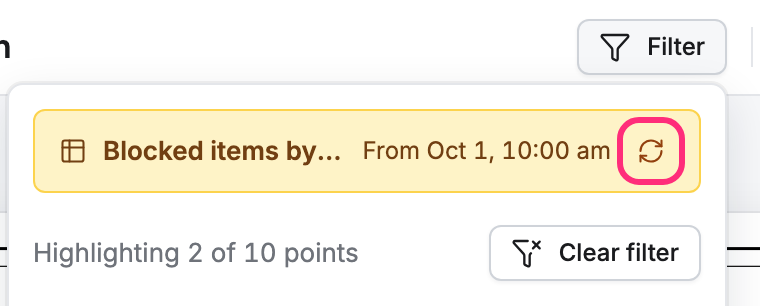
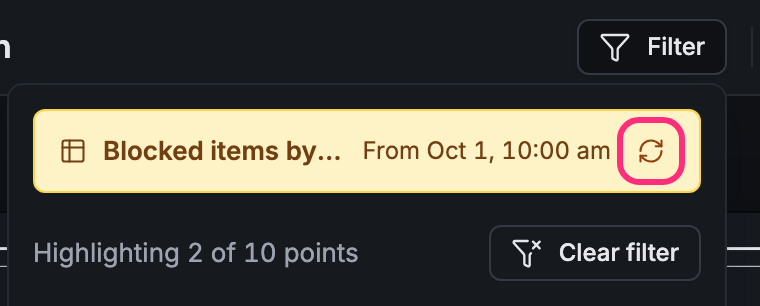
- A report that groups its points, like Blocked items by floor, is a snapshot. The filter says when it’s From. Click ↻ to run it again.
- A report that only picks points, with where steps and no groups, follows your changes as you make them: set a point’s Status to something else and it leaves the report at once. It has no time and no ↻.
Make it your own filter
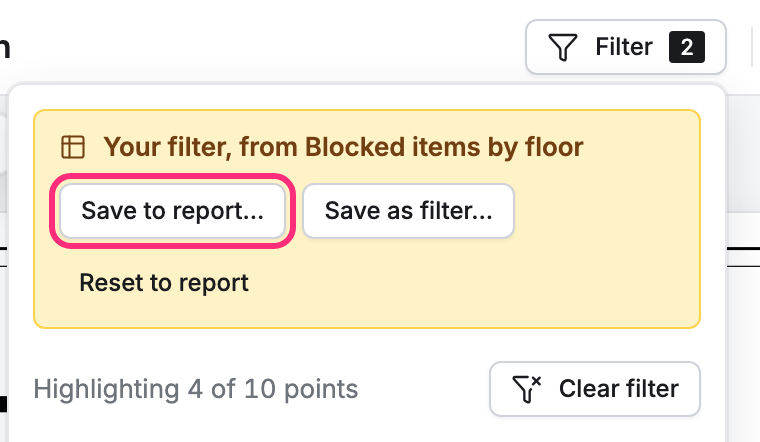
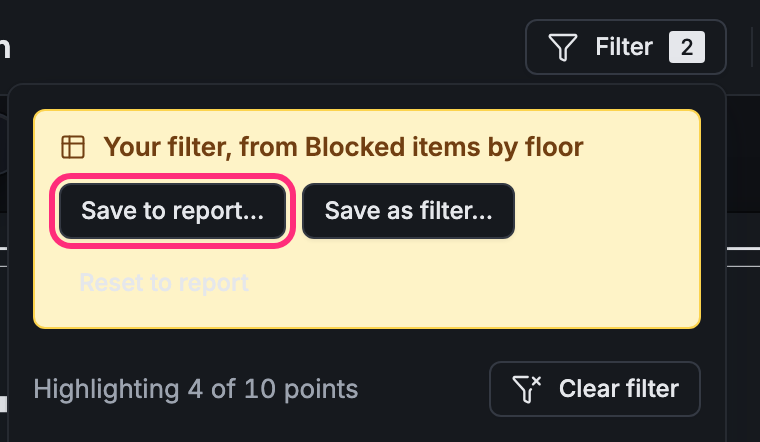
Section titled “Make it your own filter”With a report on the plan, the filter shows the report’s conditions as ticks (here, Status is Blocked). Tick or untick something and it becomes your own filter. The top of the filter says Your filter, from and the report’s name.
-
Your filter changes only what you see. The report isn’t changed.
-
Reset to report goes back to the report as it was. Unticking what you ticked does too.
-
Save as filter… keeps it as one of your saved filters.
-
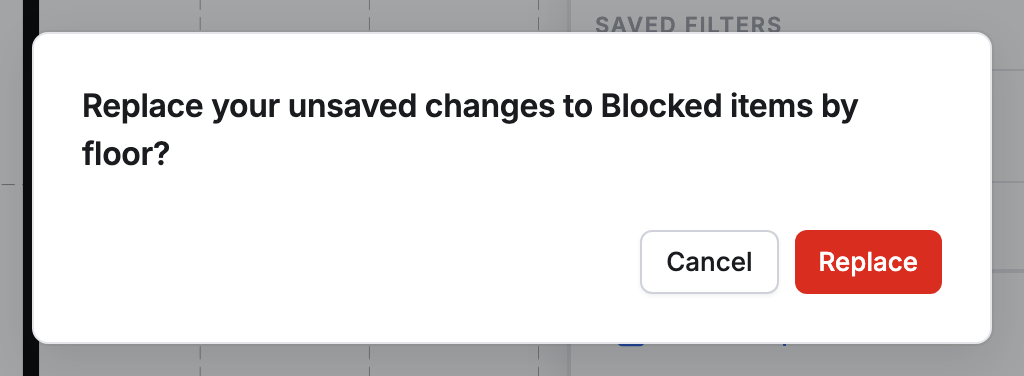
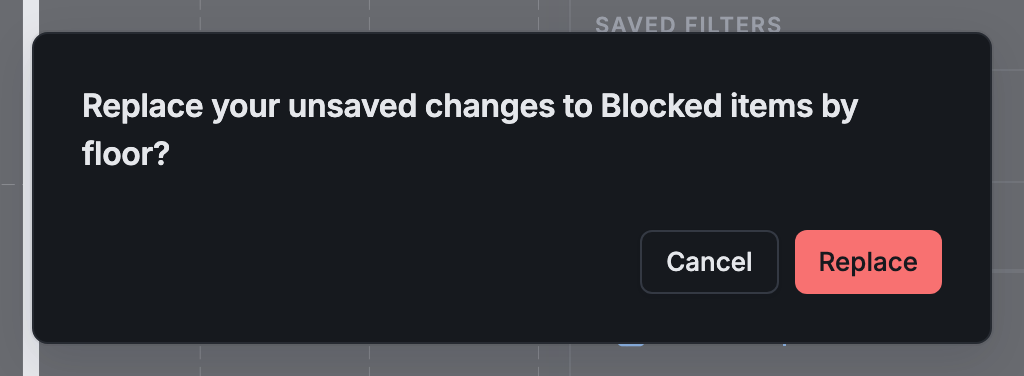
Save to report… makes your filter the report’s new conditions, as unsaved changes to the report. If the report already has changes you haven’t saved, it asks first: Replace puts your filter in their place, Cancel keeps them.
-
Back to report still takes you back to the report.
Save a filter as a report
Section titled “Save a filter as a report”Any filter can start a report:
-
Click Filter and tick what you want, with no report on the plan.
-
Click Save as report….
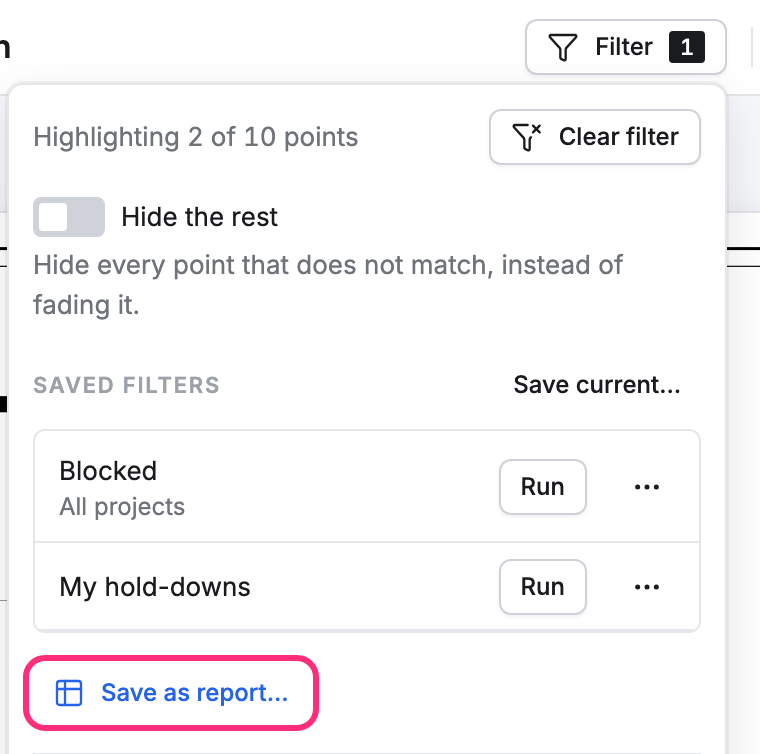
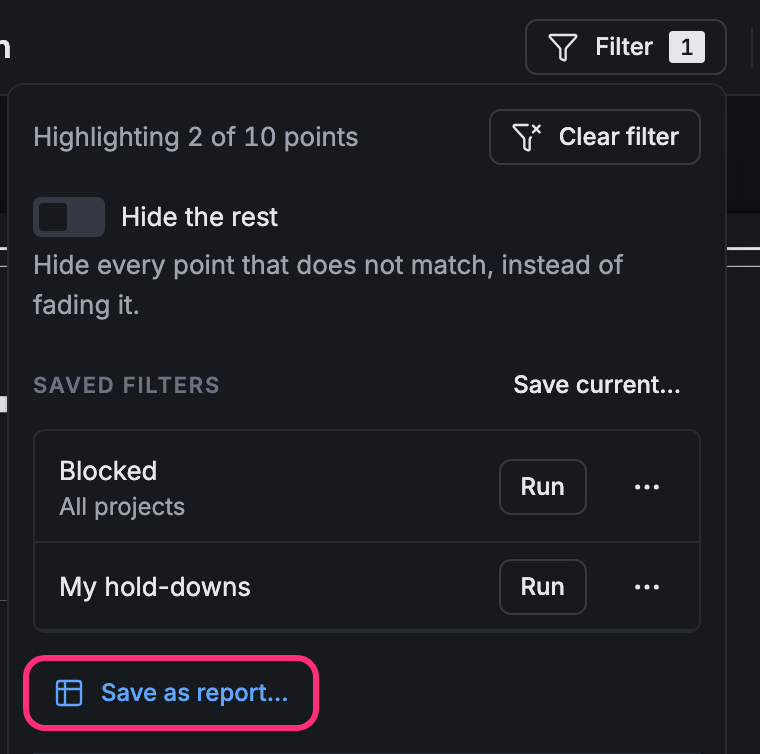
-
A new report opens with your ticks as its where steps. Change it if you like, then click Save…, give it a name and click Save. See Build a report.
See the filter as conditions
Section titled “See the filter as conditions”In the filter, click Advanced › to see your ticks as a report’s conditions. A tick on Blocked under Status reads Status is any of Blocked. + Add a condition adds another, and the × beside a condition takes it out. Click ‹ Simple to go back to the ticks.