Run a report
A report counts or lists points across a project: the items blocked on each floor, the points each person placed, the tasks done by floor. Your company’s reports are under Reports at the top of the screen.
Open a report
Section titled “Open a report”-
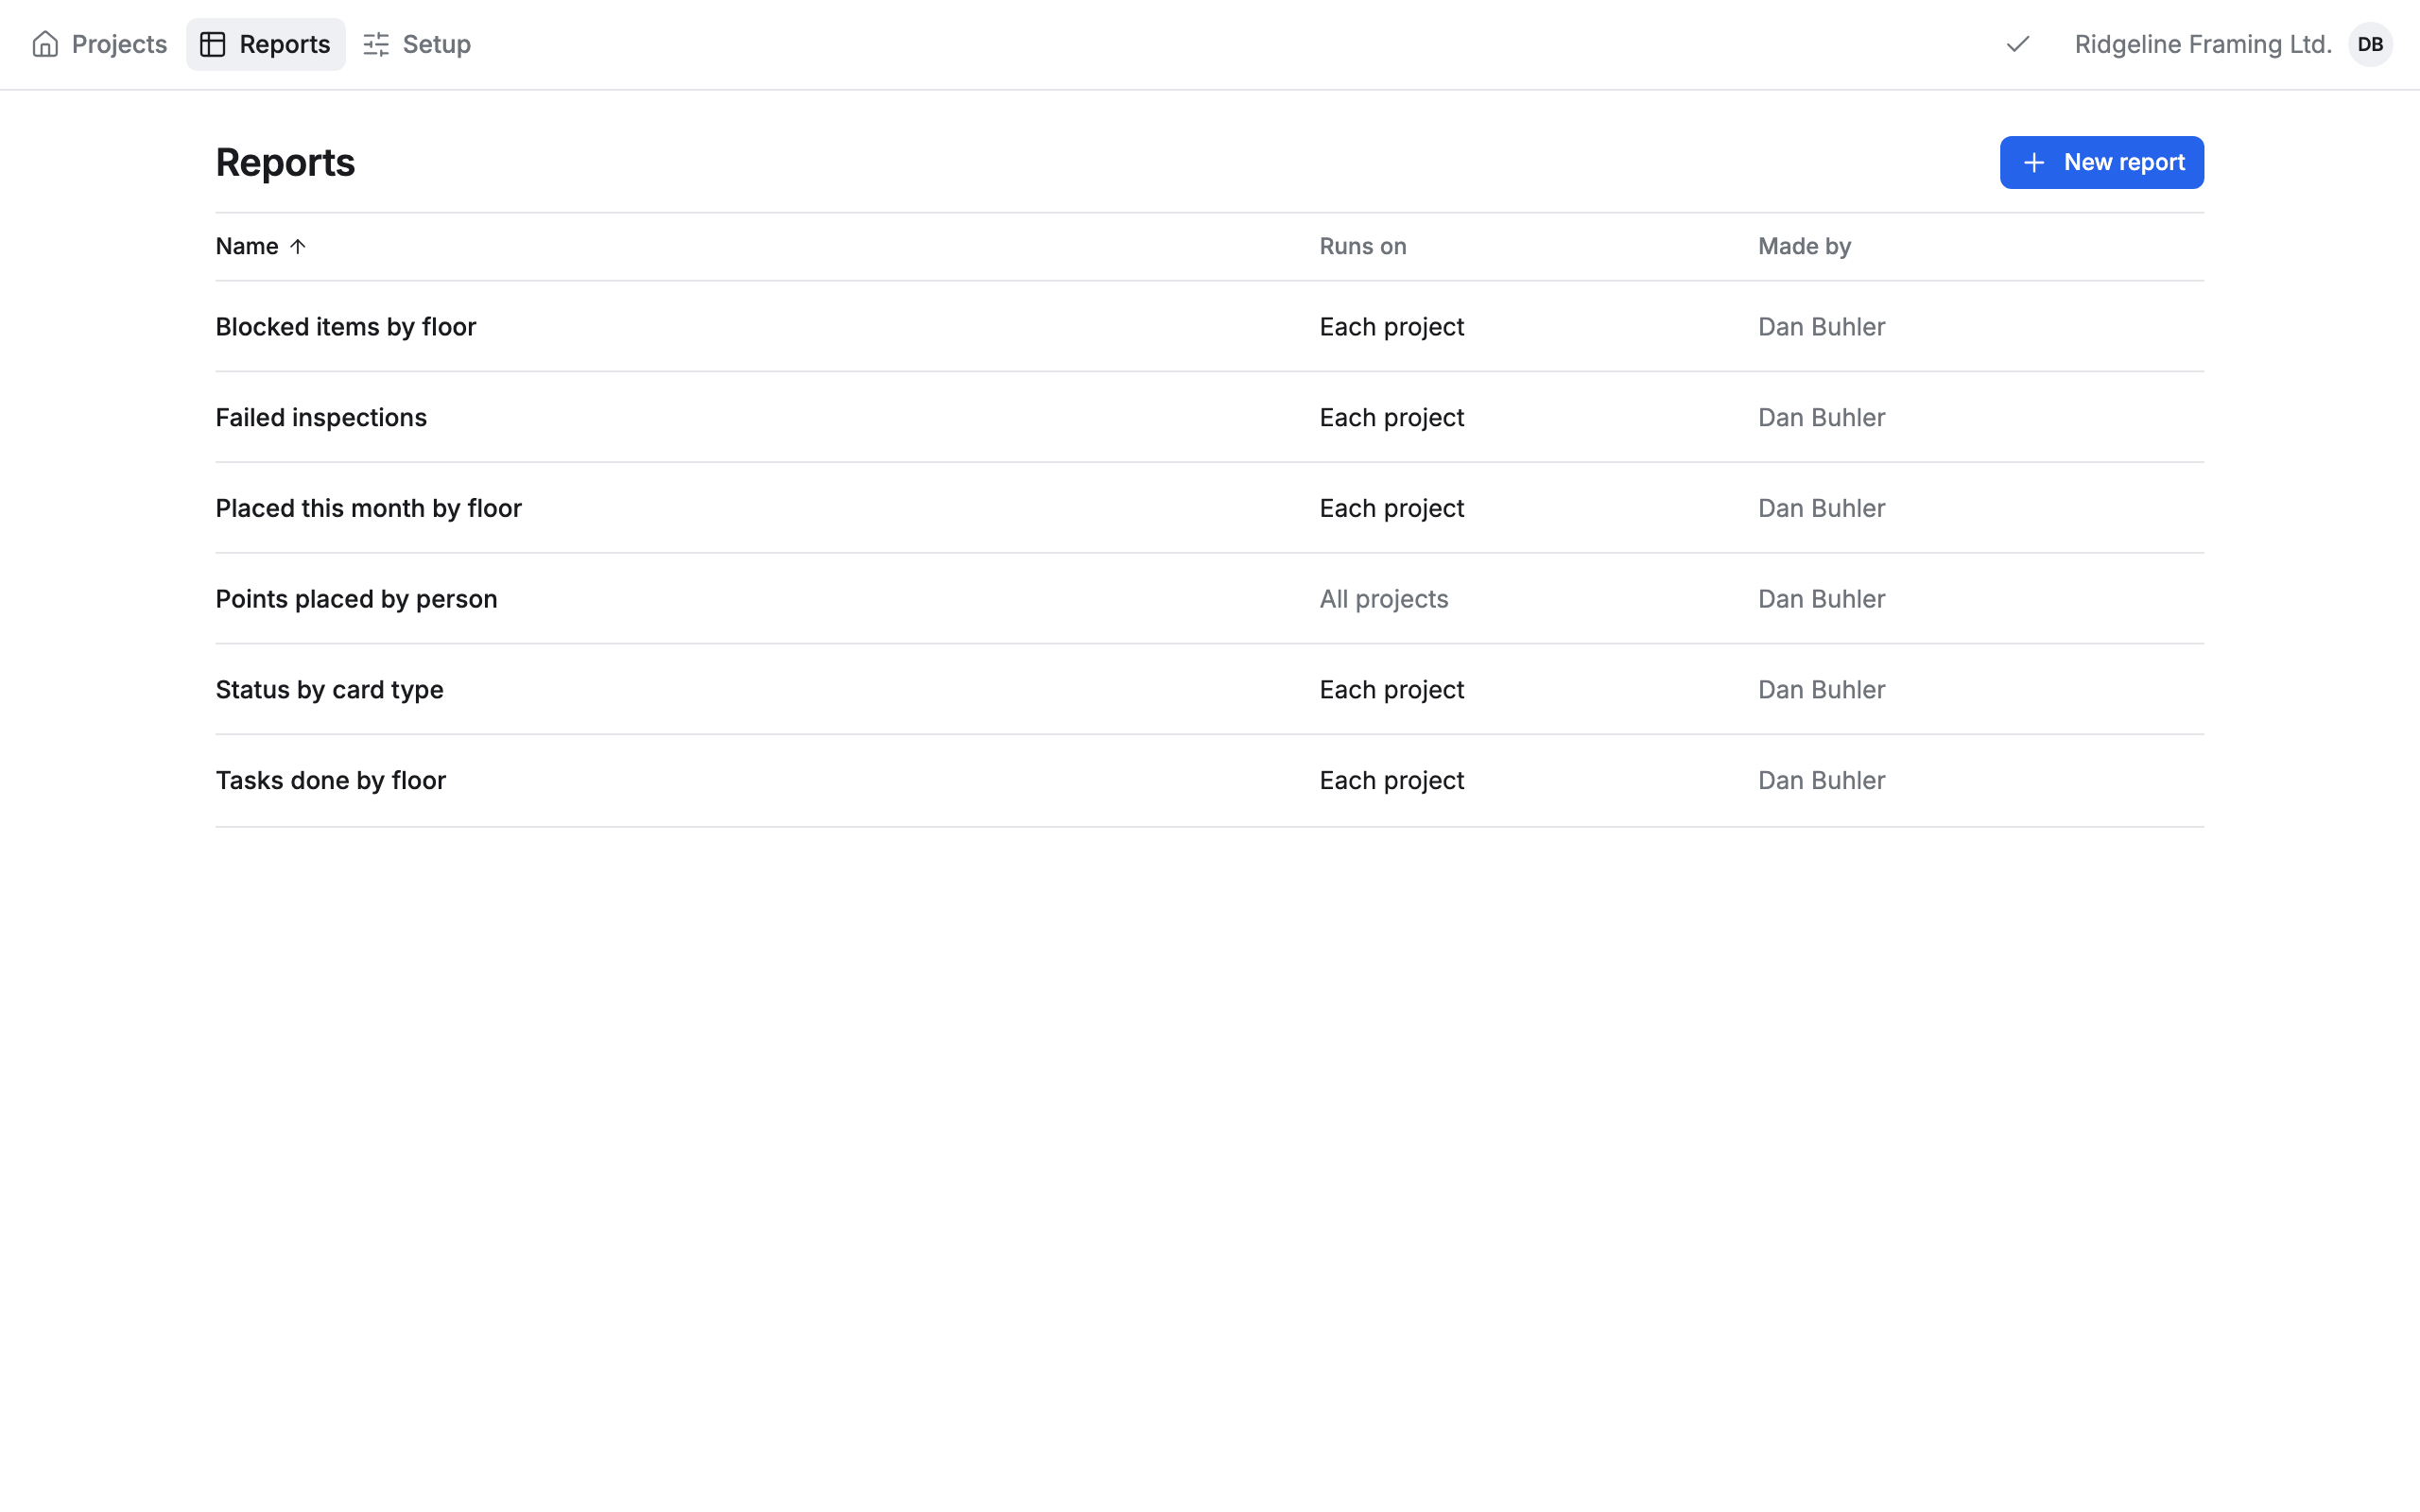
Click Reports at the top of the screen. The list shows each report’s Name, what it Runs on, and who it was Made by.
-
Most reports run on Each project: you pick the project each time. Click Each project on the report’s row and pick the project.


A report that reads All projects counts across every project you can see, so there’s nothing to pick.
-
Click the report’s name. It runs and opens.
‹ Reports at the top takes you back to the list.
A project’s own reports
Section titled “A project’s own reports”On a project’s drawings, Reports at the bottom of the Pages panel shows how many reports run on that project. Click it for the project’s list: its reports are already run on it, so click a name to open one.
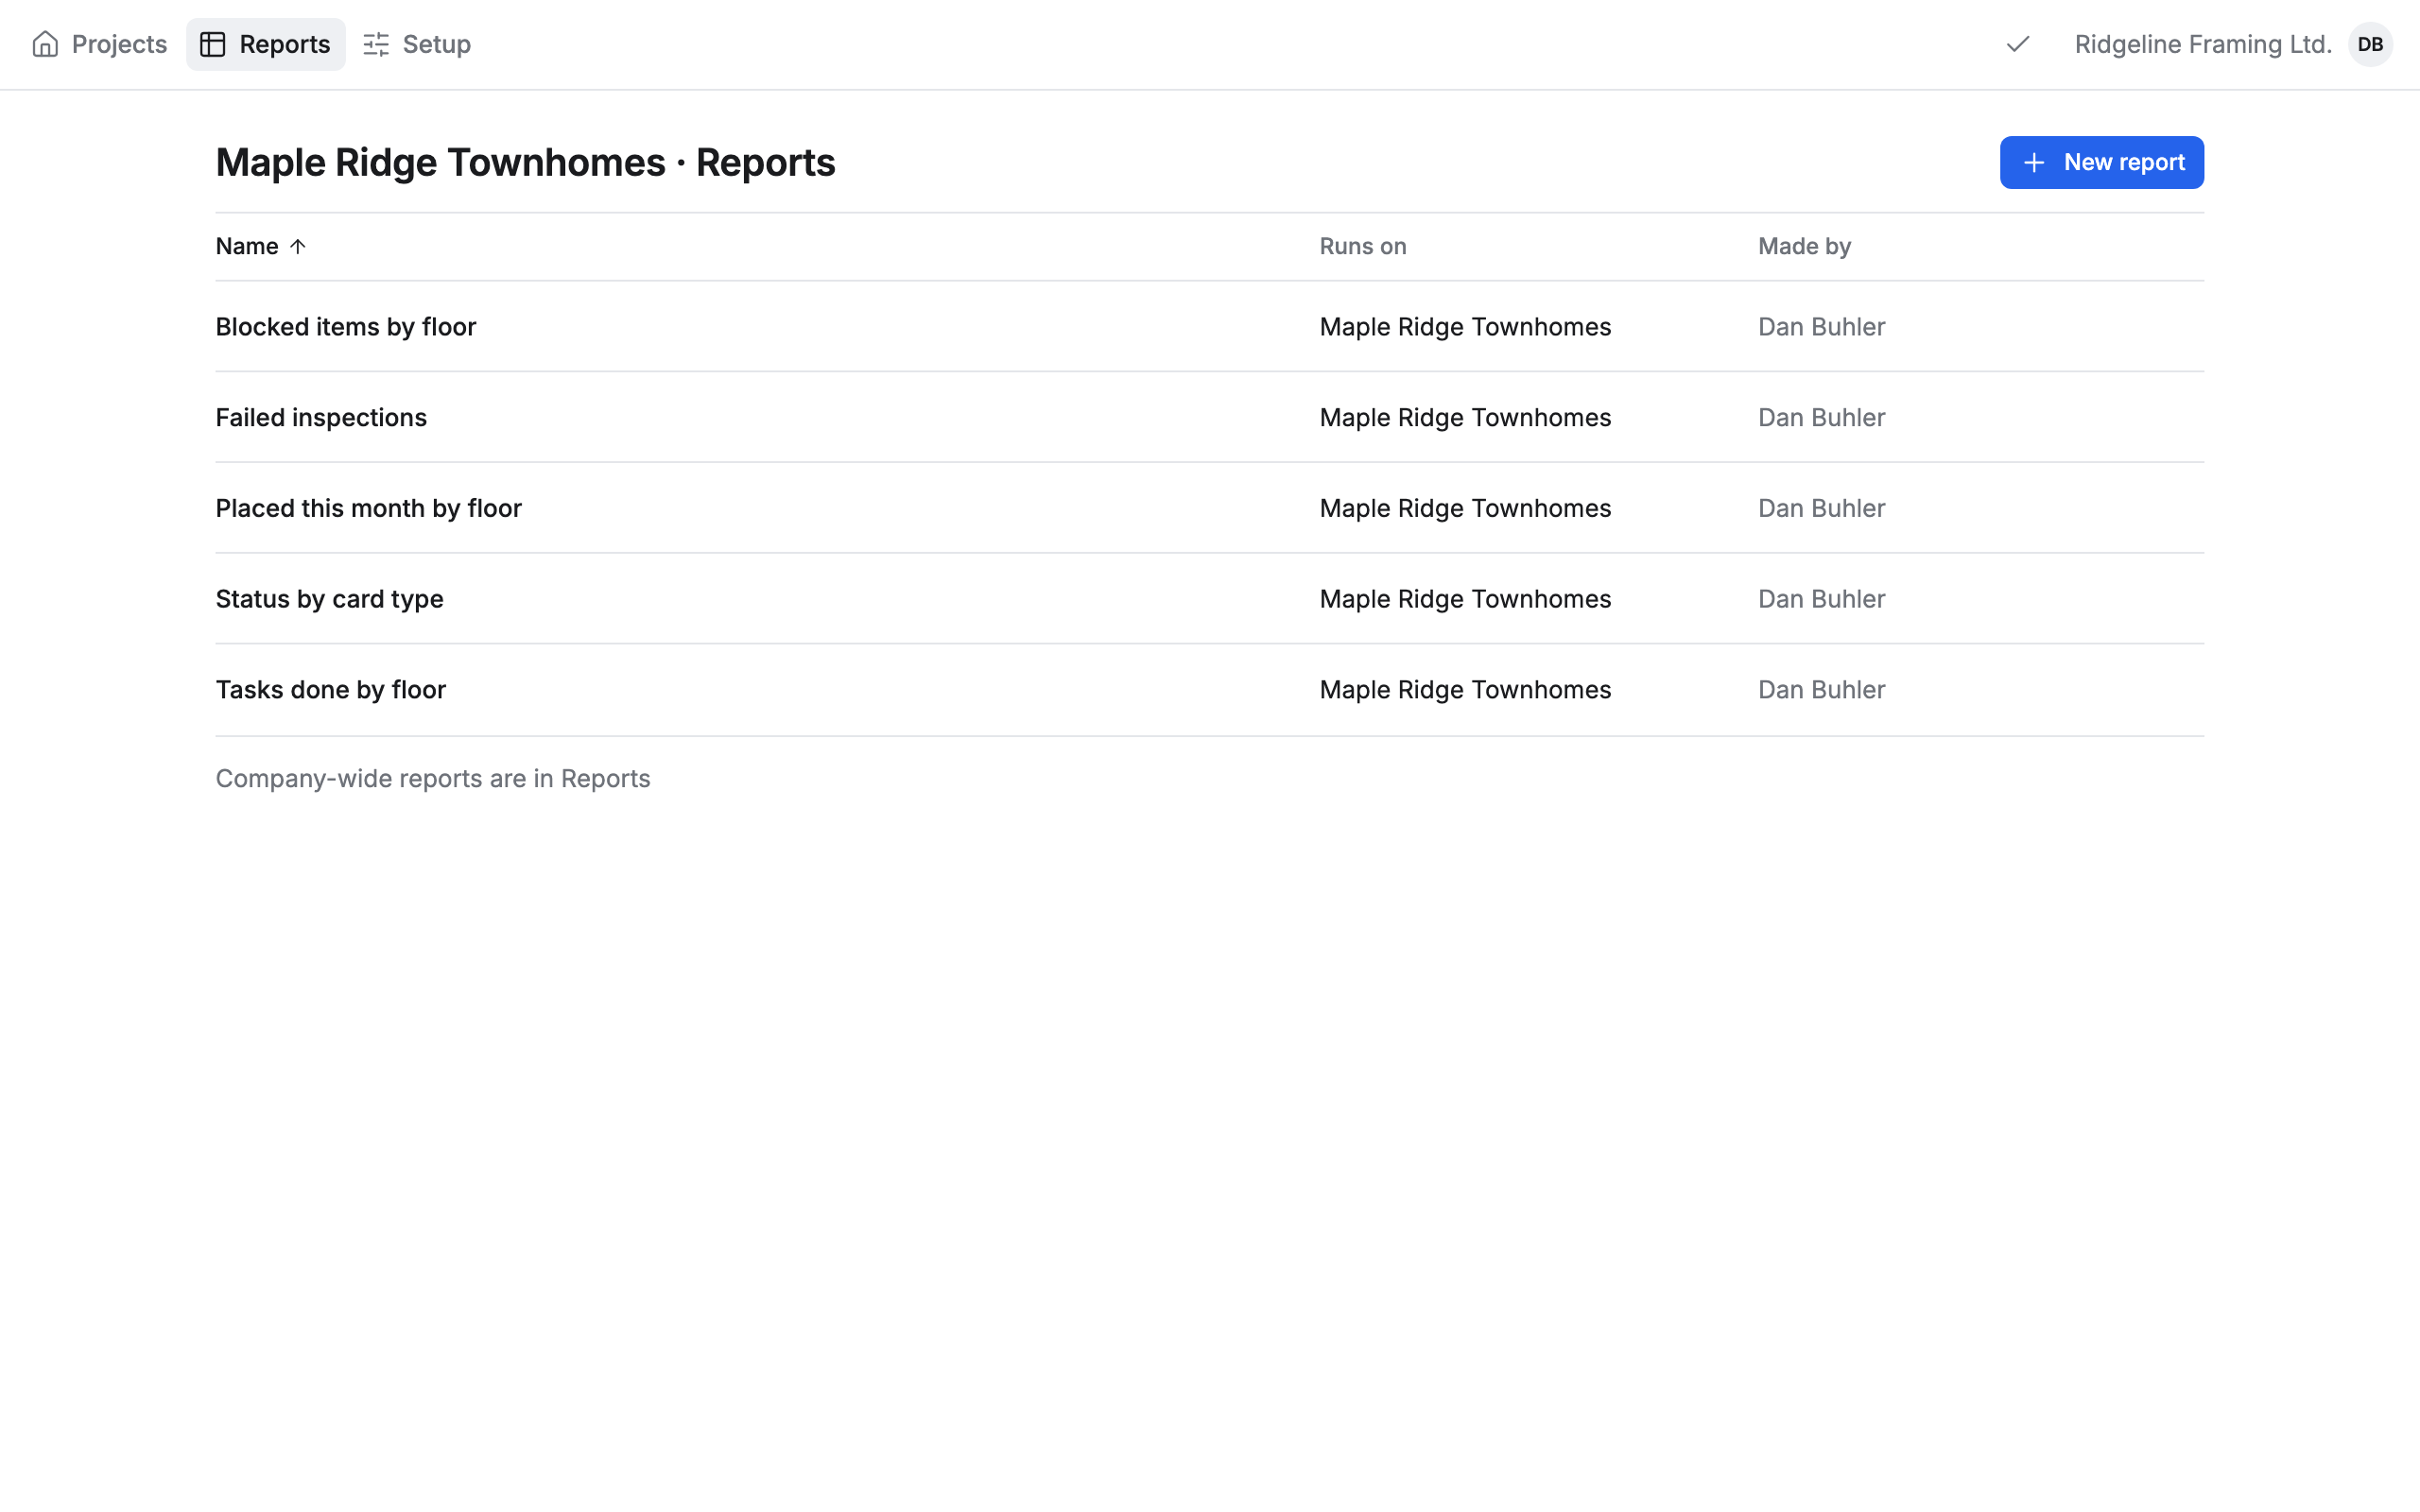
Reports that count across all projects aren’t in this list: they’re under Reports at the top of the screen.
Read a report
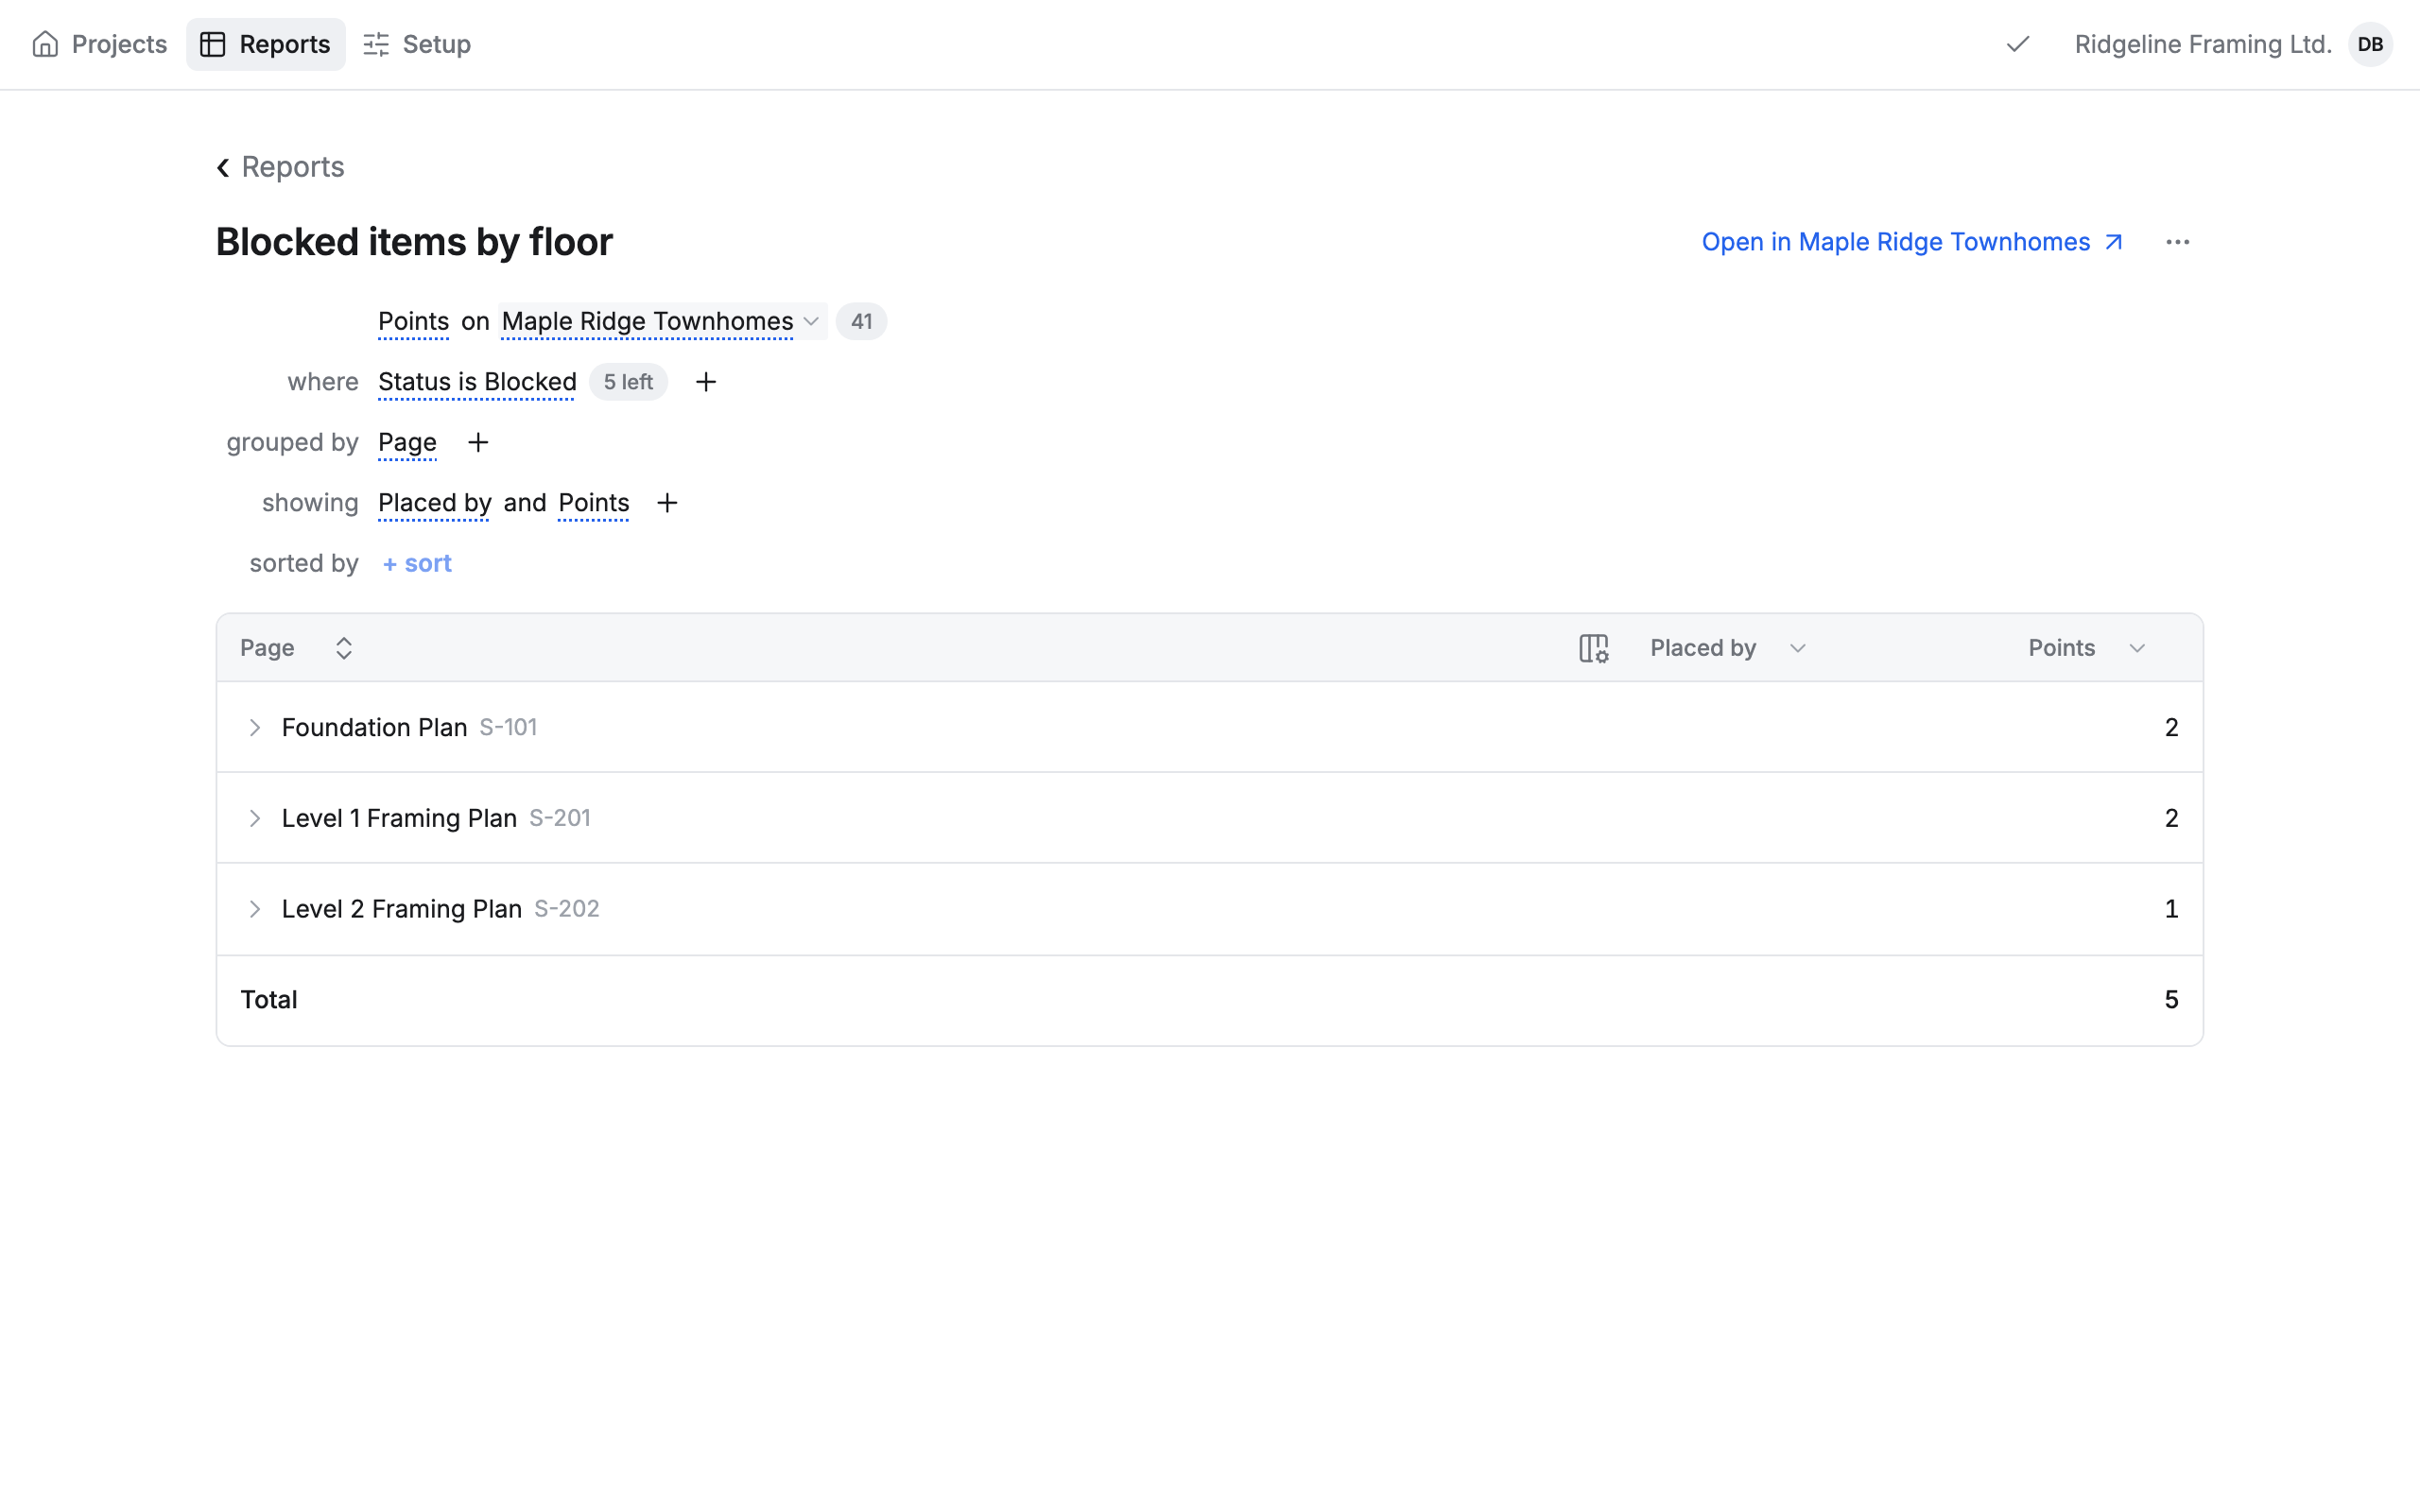
Section titled “Read a report”A report reads as a sentence, one step per line:
- Points on a project: where the report looks, and how many points are there (here 41).
- where: the conditions a point must meet. The count beside each one says how many points are left after it (here 5 left: five of the 41 points are Blocked).
- grouped by: what each row of the table is. Here it’s Page, so there’s a row for each page that has a blocked point.
- showing: the columns. Here Placed by and Points, the number of points in each row.
- sorted by: the order of the rows. + sort means the report keeps its own order.
Under the steps, the table has one row for each group, then a Total. A page’s sheet number is shown in gray after its name.
To change the steps, see Build a report. Changing them doesn’t change the report for anyone else until it’s saved.
Open a row to its points
Section titled “Open a row to its points”Each row of a report that counts points opens to list them.
- Click a row to open it. Click it again to close it.
- Click the icon beside the first column’s name to open every row at once. Click it again (Close all) to close them.
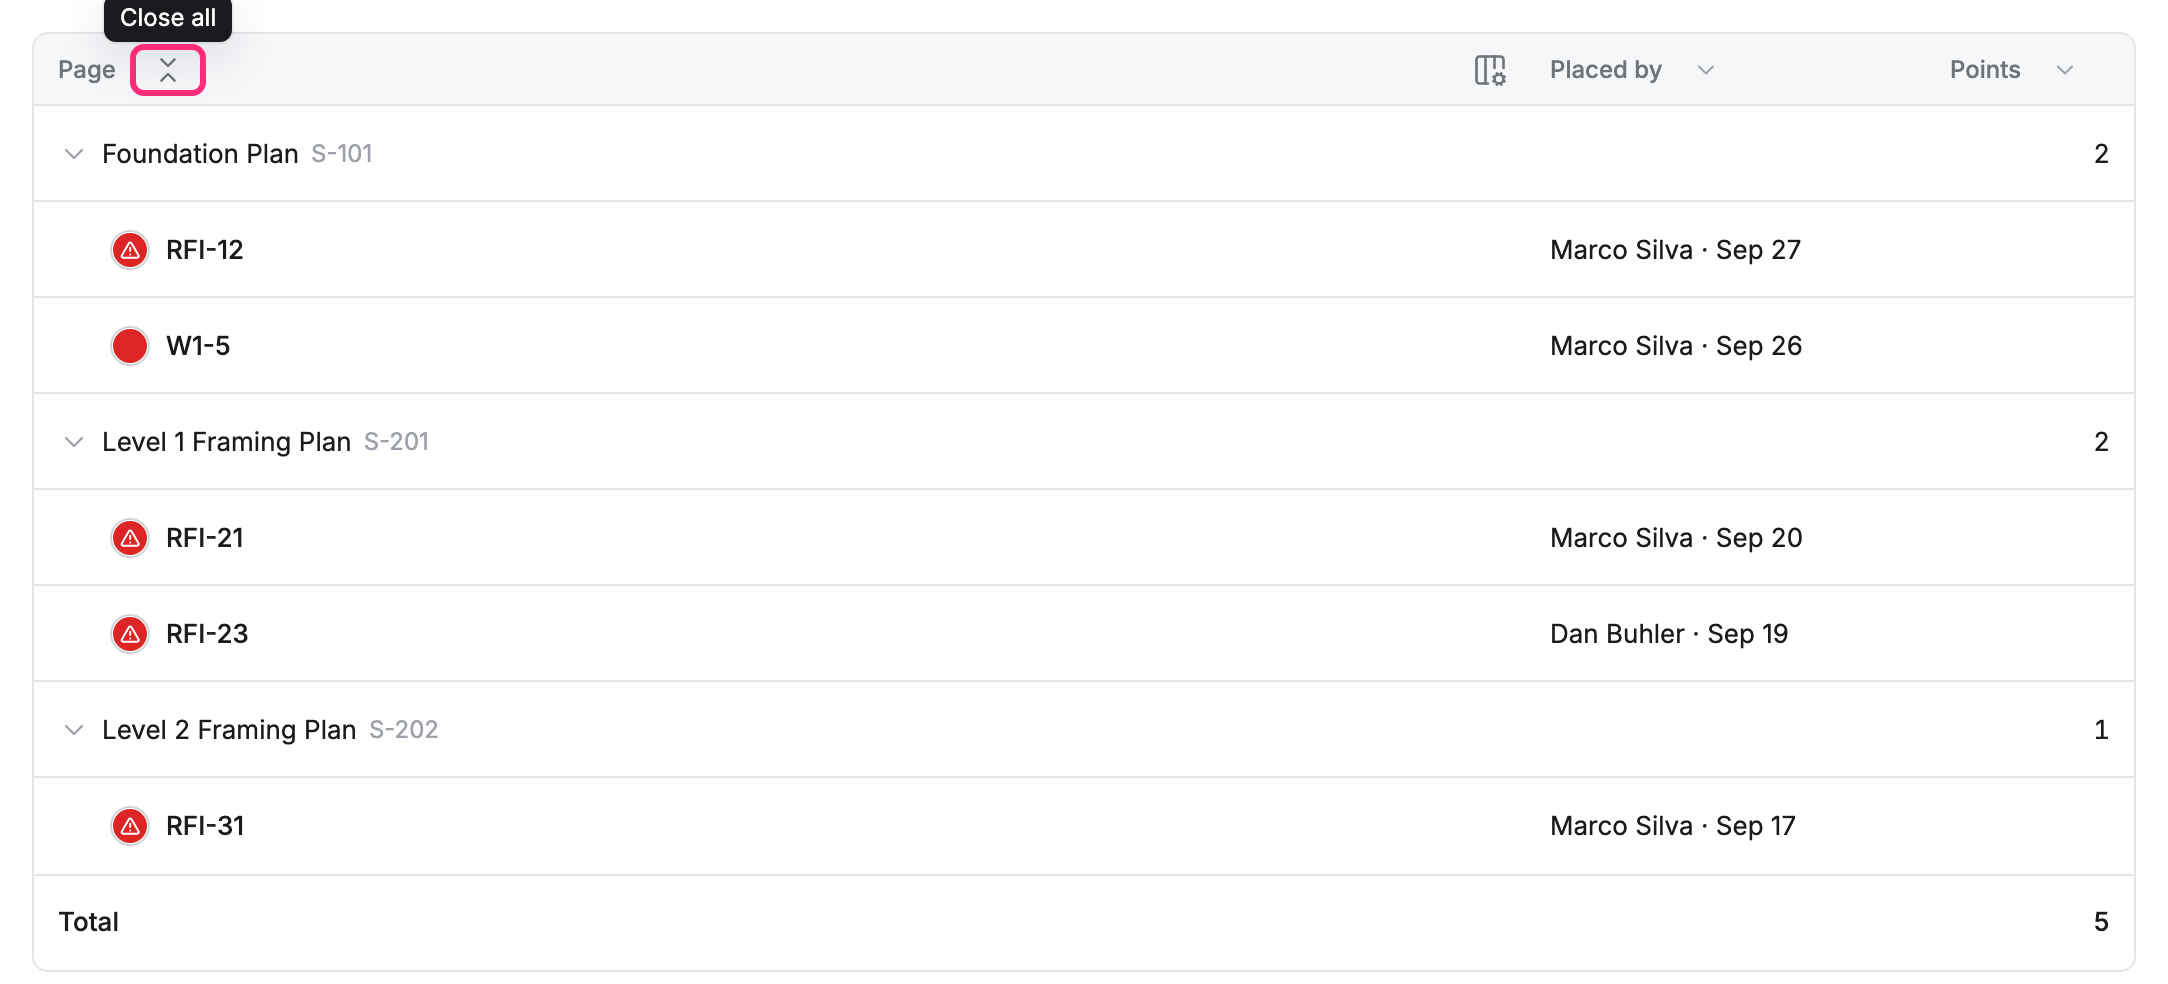
Each point shows its icon and name, and the columns the report shows: here, who placed it and when.
A report that counts tasks, like Tasks done by floor, has no rows to open.
See a point’s card beside the report
Section titled “See a point’s card beside the report”Click a point’s row. Its card opens on the right, beside the report, with a small map of where the point is on its page. You can change the card here as you would on the plan.
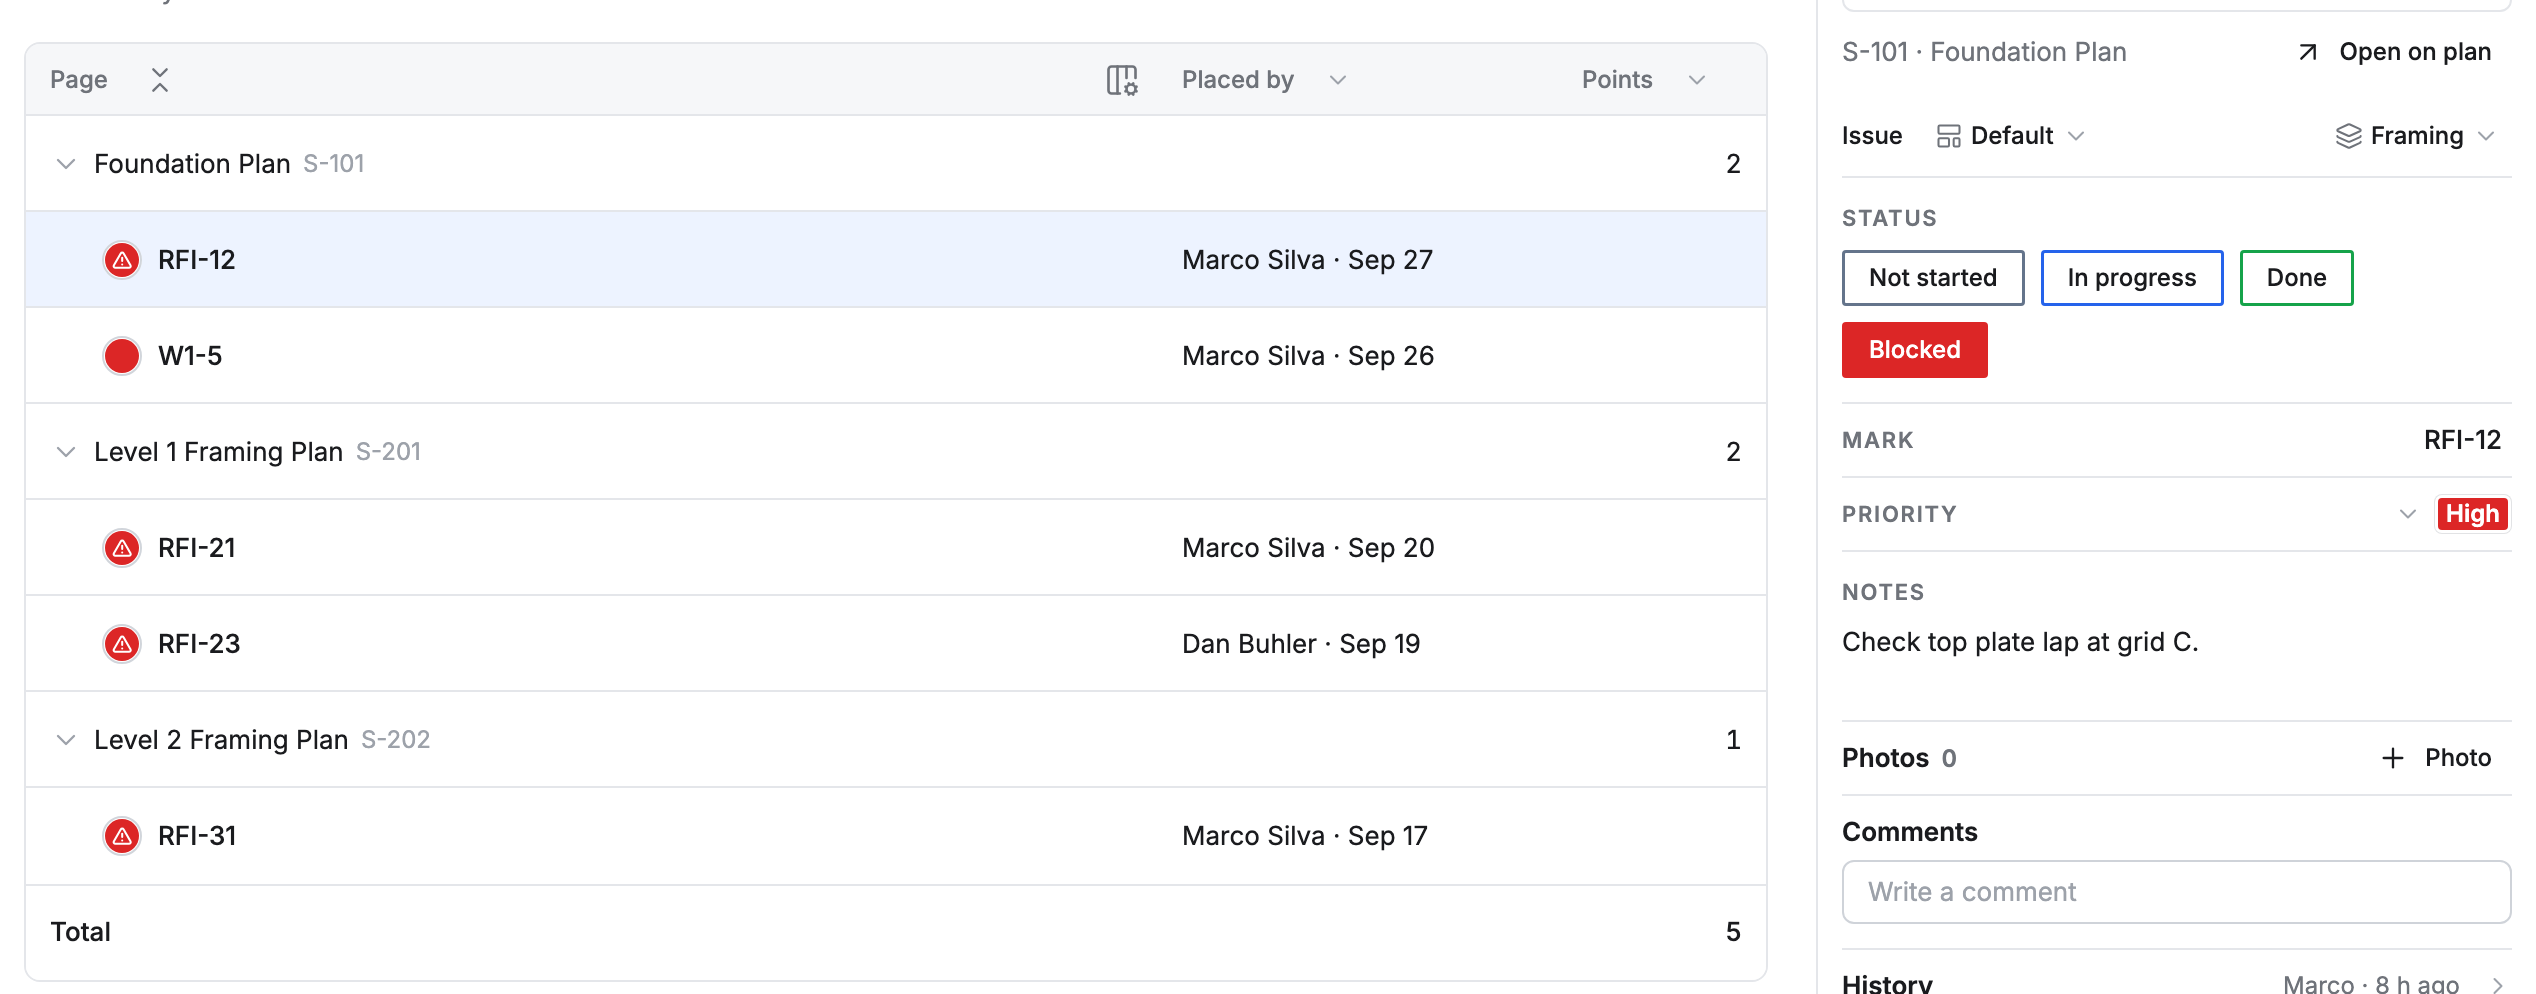
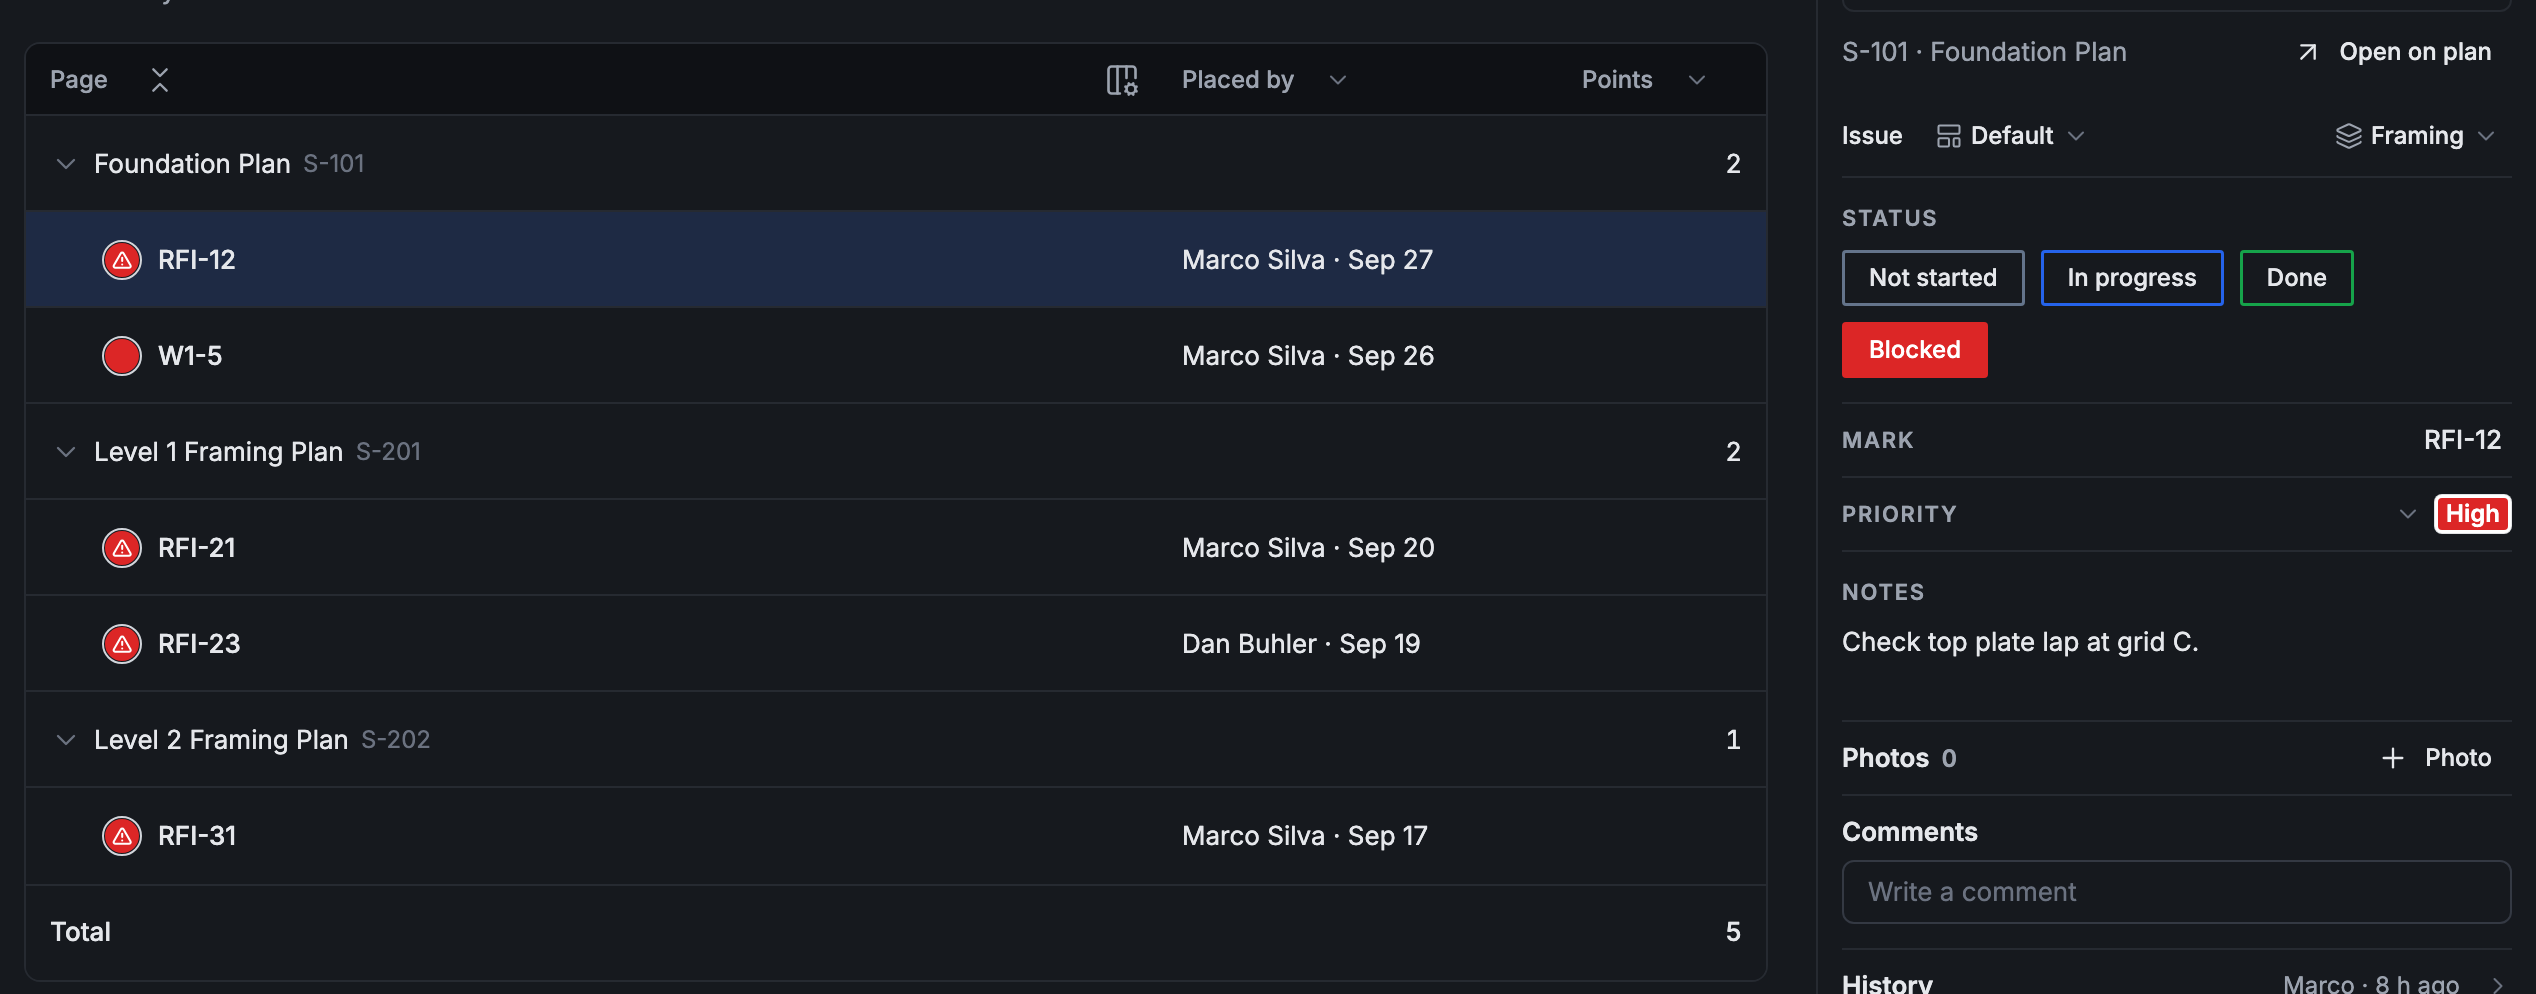
- Click Open on plan on the card to go to the point on its drawing.
- Press Esc, or click the × at the top of the card, to close it.
- Double-click a point’s row to go straight to the plan.
If you change a point so it no longer fits the report (say, its Status from Blocked to In progress), its row is marked as edited, and the report runs again and leaves it out.
Sort the table
Section titled “Sort the table”Click a column’s name at the top of the table to sort the rows by it: click once for low to high (↑), again for high to low (↓), and a third time to go back to the report’s own order.
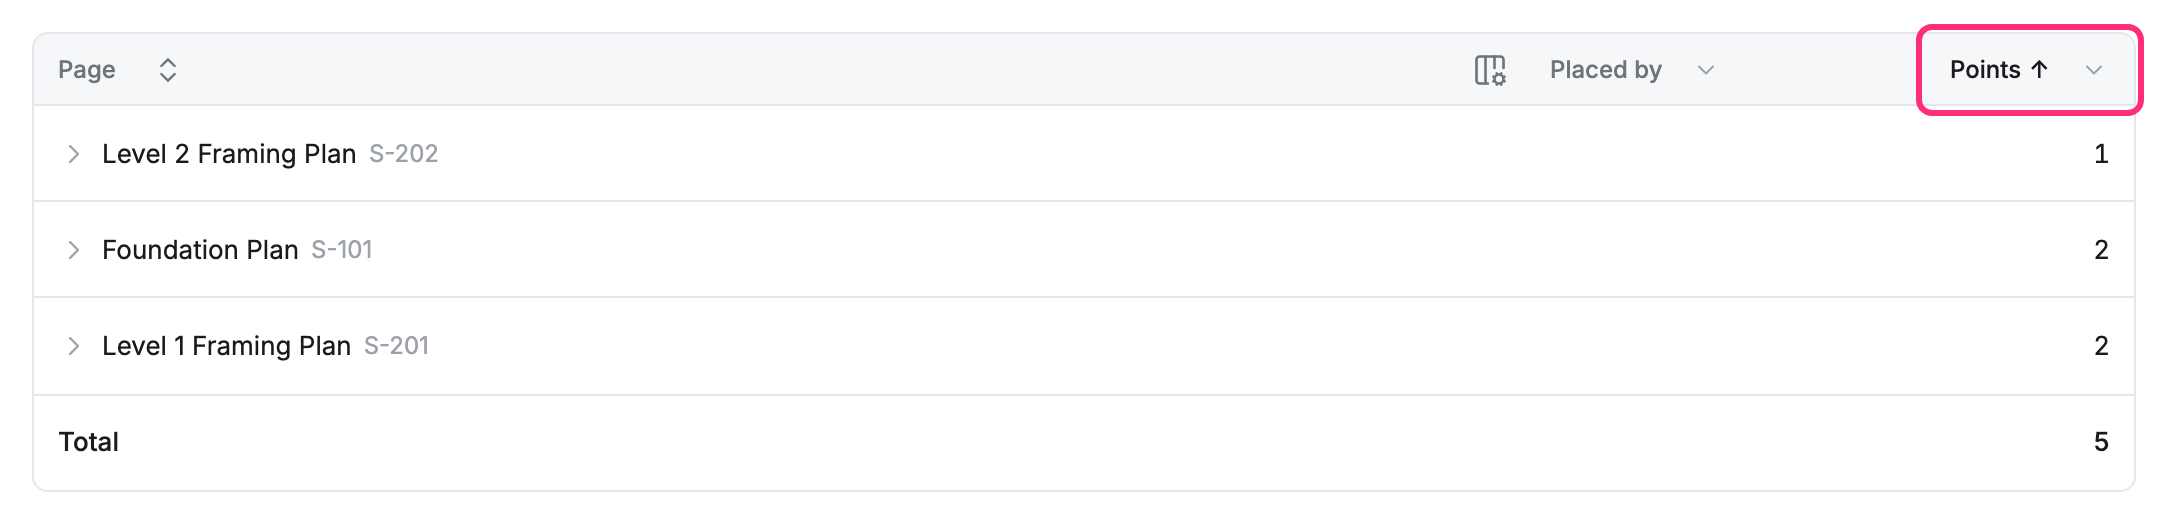
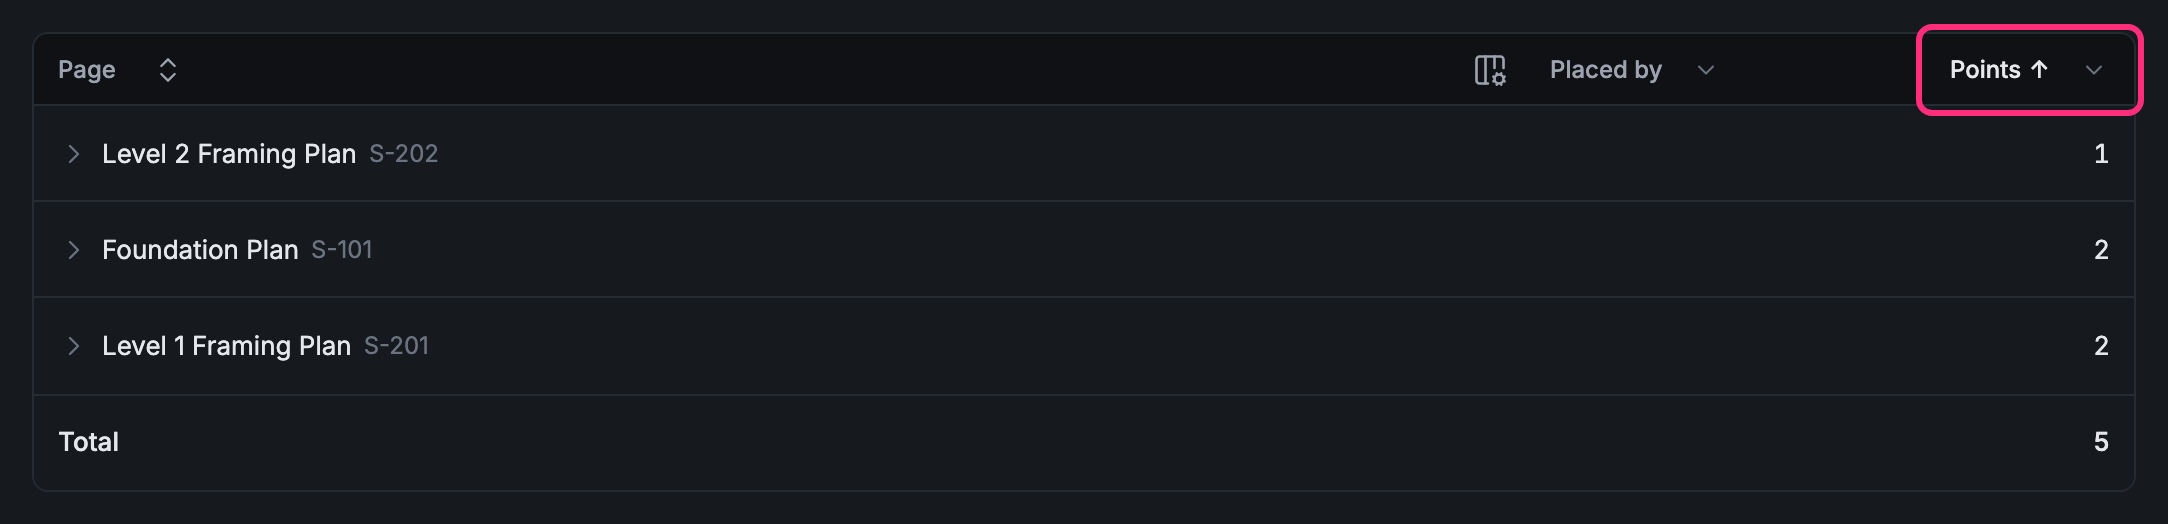
This sorts only what you see. It doesn’t change the report, and the next time you open it, it’s in its own order.
When you’re offline
Section titled “When you’re offline”A report runs on Pointmap’s server, so it needs a connection. Offline, a report you’ve opened before shows its last result, with the time it’s from under its name: From a date and time · offline. Its rows and totals are as they were then.
What you see
Section titled “What you see”A report counts only what you’re allowed to see. If your access leaves some points out, the report says Limited by your access.
- See a report on the plan: light up a report’s points on the drawings.
- Build a report: start one of your own.